## Image Comparison: Atmospheric Perspective with and without Linear Transform (LT)
### Overview
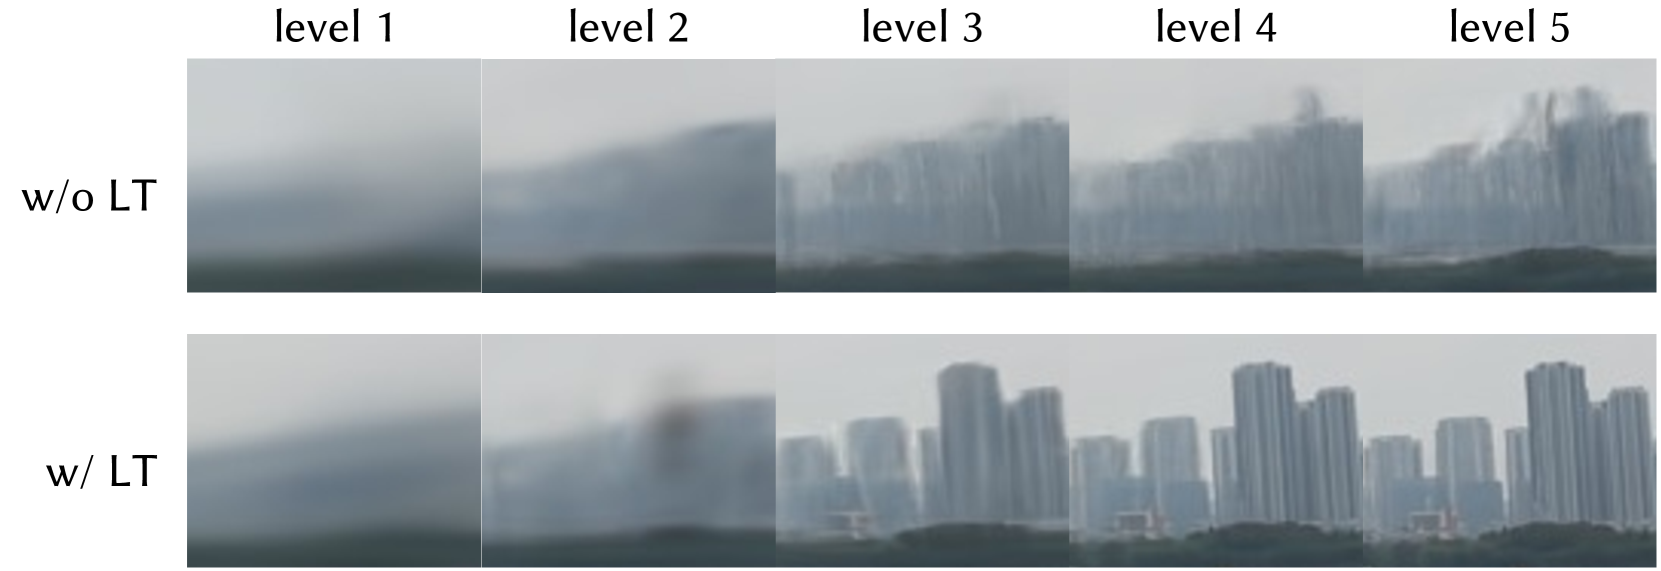
The image presents a comparison of atmospheric perspective in a landscape scene, with and without the application of a linear transform (LT). The scene is rendered at five different levels, presumably representing increasing levels of detail or resolution. The top row displays the scene without LT, while the bottom row shows the scene with LT applied. The primary visual difference is the increased clarity and detail in the bottom row, particularly at higher levels.
### Components/Axes
* **Rows:**
* Row 1: "w/o LT" (without Linear Transform)
* Row 2: "w/ LT" (with Linear Transform)
* **Columns:**
* Column 1: "level 1"
* Column 2: "level 2"
* Column 3: "level 3"
* Column 4: "level 4"
* Column 5: "level 5"
* **Scene:** The scene appears to be a cityscape viewed from a distance, with a body of water or land in the foreground and buildings in the background.
### Detailed Analysis or ### Content Details
**Row 1: w/o LT (without Linear Transform)**
* **Level 1:** The image is highly blurred, with only a vague distinction between the sky, horizon, and foreground.
* **Level 2:** Some indistinct shapes begin to appear, suggesting the presence of landforms or structures, but the image remains blurry.
* **Level 3:** Vertical lines become visible, hinting at the presence of buildings or other vertical structures. The overall image is still hazy.
* **Level 4:** The vertical structures become more defined, but the image remains blurred and lacks detail.
* **Level 5:** The structures are more clearly visible, but the image still suffers from significant atmospheric haze, obscuring fine details.
**Row 2: w/ LT (with Linear Transform)**
* **Level 1:** Similar to the "w/o LT" version, the image is blurred, but perhaps slightly less so.
* **Level 2:** The image is still blurry, but there is a slight improvement in clarity compared to the "w/o LT" version.
* **Level 3:** The vertical structures are more defined and less hazy than in the "w/o LT" version.
* **Level 4:** The buildings are clearly visible, with some details starting to emerge. The atmospheric haze is significantly reduced compared to the "w/o LT" version.
* **Level 5:** The buildings are sharply defined, with a high level of detail. The atmospheric haze is minimal, allowing for a clear view of the cityscape.
### Key Observations
* The application of the linear transform (LT) significantly improves the clarity and detail of the scene, especially at higher levels.
* Without LT, the atmospheric haze obscures details, making it difficult to discern the structures in the scene.
* The difference between "w/ LT" and "w/o LT" becomes more pronounced as the level increases.
### Interpretation
The image demonstrates the effectiveness of a linear transform (LT) in mitigating the effects of atmospheric perspective. Atmospheric perspective causes distant objects to appear blurry and less distinct due to the scattering of light by particles in the atmosphere. The LT appears to compensate for this effect, resulting in a clearer and more detailed image. The increasing clarity with higher levels suggests that the LT is more effective at higher resolutions or levels of detail. This technique could be valuable in applications such as remote sensing, computer vision, and image processing, where it is important to accurately represent distant objects.