## Image Comparison: "w/o LT" vs "w/ LT" Across Levels
### Overview
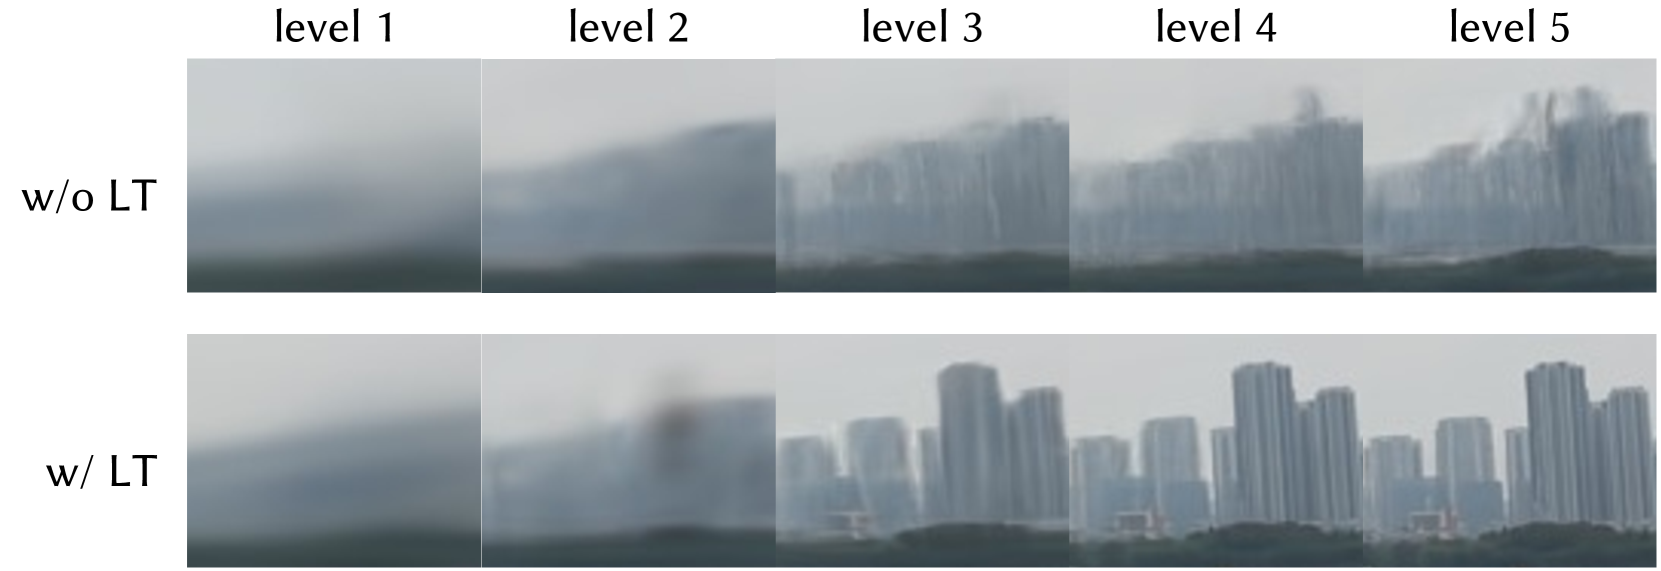
The image presents a side-by-side comparison of two sets of visualizations labeled "w/o LT" (without LT) and "w/ LT" (with LT), each spanning five levels (level 1 to level 5). The visuals appear to represent a progression of clarity or detail, with "w/ LT" showing significantly improved definition compared to "w/o LT".
### Components/Axes
- **Rows**:
- Top row: "w/o LT" (without LT)
- Bottom row: "w/ LT" (with LT)
- **Columns**:
- Five levels labeled "level 1" to "level 5" (left to right).
- **Visual Elements**:
- Blurred shapes in "w/o LT" (top row) vs. increasingly defined structures in "w/ LT" (bottom row).
- No explicit numerical data, axis scales, or legends are present.
### Detailed Analysis
- **Level 1**:
- "w/o LT": Extremely blurry, indistinct shapes.
- "w/ LT": Slightly clearer but still vague.
- **Level 2**:
- "w/o LT": Minimal improvement; shapes remain indistinct.
- "w/ LT": Slightly more defined, but details are still ambiguous.
- **Level 3**:
- "w/o LT": Slightly better than level 2 but still highly blurred.
- "w/ LT": Clearer structures emerge (e.g., vertical lines or columns).
- **Level 4**:
- "w/o LT": Minimal progress; shapes remain indistinct.
- "w/ LT": Distinct vertical structures (e.g., buildings or towers) become visible.
- **Level 5**:
- "w/o LT": Slight improvement but still blurry.
- "w/ LT": Fully defined structures (e.g., a cityscape with tall buildings).
### Key Observations
1. **Progressive Clarity**: Both rows show gradual improvement from level 1 to level 5, but "w/ LT" achieves significantly higher clarity.
2. **Structural Definition**: "w/ LT" reveals coherent vertical structures (e.g., buildings) by level 4, while "w/o LT" remains indistinct.
3. **Threshold Effect**: The improvement in "w/ LT" appears to plateau at level 5, suggesting a maximum achievable clarity.
### Interpretation
The image demonstrates that the "LT" (likely a technical process, algorithm, or feature) enhances visual clarity across all levels. Without LT, the visuals remain blurry and lack definable structures, while with LT, the progression reveals increasingly detailed and coherent forms. This suggests LT plays a critical role in resolving ambiguity or noise in the data representation. The absence of numerical values or explicit labels limits quantitative analysis, but the visual trend strongly supports the efficacy of LT in improving clarity.