## Line Graph: Cumulative solving + checking time
### Overview
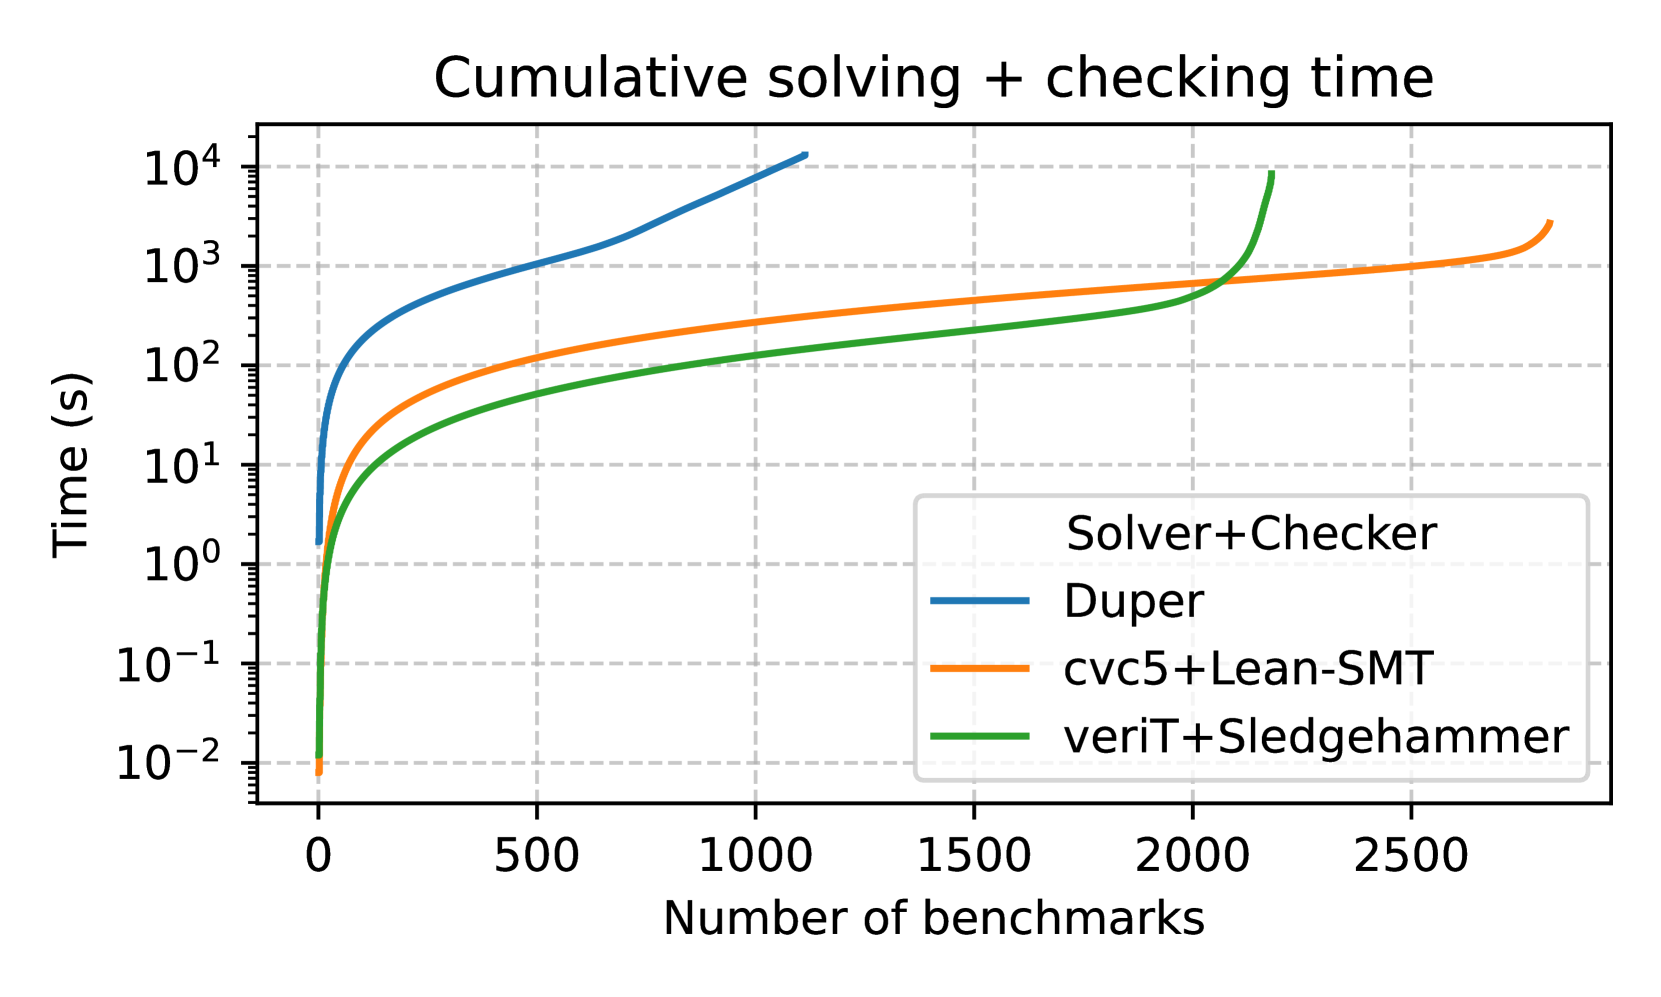
The graph compares the cumulative solving and checking time (in seconds) across three solver+checker combinations as the number of benchmarks increases from 0 to 2500. The y-axis uses a logarithmic scale (10^-2 to 10^4 seconds), while the x-axis is linear.
### Components/Axes
- **X-axis**: Number of benchmarks (0–2500, linear scale)
- **Y-axis**: Time (s) (10^-2 to 10^4, logarithmic scale)
- **Legend**: Located in the bottom-right corner, with three entries:
- **Blue line**: Duper
- **Orange line**: cvc5+Lean-SMT
- **Green line**: veriT+Sledgehammer
### Detailed Analysis
1. **Duper (Blue line)**:
- Starts at ~0.1 seconds for 0 benchmarks.
- Rises sharply to ~1000 seconds at 1000 benchmarks.
- Plateaus slightly above 1000 benchmarks, reaching ~3000 seconds at 2500 benchmarks.
- **Key trend**: Exponential growth on the logarithmic scale, indicating rapid time increases with benchmarks.
2. **cvc5+Lean-SMT (Orange line)**:
- Begins at ~0.01 seconds for 0 benchmarks.
- Gradually increases to ~200 seconds at 1000 benchmarks.
- Continues rising steadily to ~350 seconds at 2500 benchmarks.
- **Key trend**: Linear growth on the logarithmic scale, suggesting sub-exponential time complexity.
3. **veriT+Sledgehammer (Green line)**:
- Starts at ~0.001 seconds for 0 benchmarks.
- Remains flat until ~2000 benchmarks, then surges to ~1000 seconds at 2000 benchmarks.
- Accelerates further to ~2000 seconds at 2500 benchmarks.
- **Key trend**: Sudden nonlinear increase after 2000 benchmarks, contrasting with earlier stability.
### Key Observations
- **Duper** exhibits the steepest growth, with time increasing ~100x between 1000 and 2500 benchmarks.
- **cvc5+Lean-SMT** maintains the slowest growth rate across all benchmarks.
- **veriT+Sledgehammer** shows a stark performance drop after 2000 benchmarks, with time increasing ~10x between 2000 and 2500 benchmarks.
- All lines intersect near 0 benchmarks, but diverge significantly as benchmarks increase.
### Interpretation
The data suggests:
1. **Scalability differences**: Duper’s exponential time growth makes it unsuitable for large benchmark sets, while cvc5+Lean-SMT scales more efficiently.
2. **veriT+Sledgehammer’s anomaly**: Its stable performance until 2000 benchmarks followed by a sharp decline implies potential algorithmic limitations or optimization thresholds.
3. **Logarithmic scale implications**: The y-axis compression highlights Duper’s disproportionate time costs at higher benchmarks, which might be overlooked on a linear scale.
The graph underscores trade-offs between solver+checker combinations, with cvc5+Lean-SMT appearing most efficient for large-scale applications. The veriT+Sledgehammer combination warrants further investigation into its post-2000 performance degradation.