## Line Chart: Exact Match vs. SFT Data Ratio for Different 'n' Values
### Overview
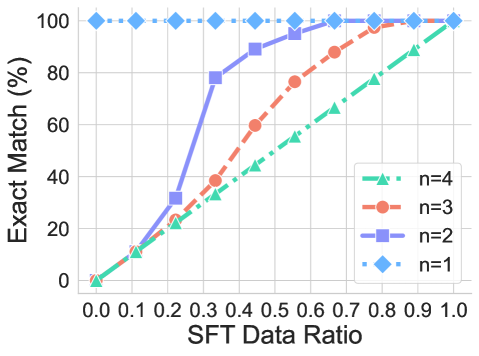
The image is a line chart showing the relationship between "SFT Data Ratio" (x-axis) and "Exact Match (%)" (y-axis) for four different values of 'n' (n=1, n=2, n=3, n=4). The chart illustrates how the exact match percentage changes as the SFT data ratio increases, for each 'n' value.
### Components/Axes
* **X-axis:** "SFT Data Ratio" ranges from 0.0 to 1.0 in increments of 0.1.
* **Y-axis:** "Exact Match (%)" ranges from 0 to 100 in increments of 20.
* **Legend:** Located on the right side of the chart, it identifies the line colors and markers corresponding to each 'n' value:
* **Green (Triangle marker):** n=4
* **Salmon (Circle marker):** n=3
* **Blue-Purple (Square marker):** n=2
* **Light Blue (Diamond marker):** n=1
### Detailed Analysis
* **n=1 (Light Blue, Diamond marker, Dotted Line):** The line remains constant at 100% across all SFT Data Ratio values.
* (0.0, 100%), (0.1, 100%), (0.2, 100%), (0.3, 100%), (0.4, 100%), (0.5, 100%), (0.6, 100%), (0.7, 100%), (0.8, 100%), (0.9, 100%), (1.0, 100%)
* **n=2 (Blue-Purple, Square marker, Solid Line):** The line increases sharply from 0% to 100% between SFT Data Ratio values of 0.0 and 0.7.
* (0.0, 0%), (0.1, ~10%), (0.2, ~30%), (0.3, ~75%), (0.4, ~90%), (0.5, ~98%), (0.6, ~100%), (0.7, ~100%), (0.8, ~100%), (0.9, ~100%), (1.0, ~100%)
* **n=3 (Salmon, Circle marker, Dashed Line):** The line increases gradually from 0% to 100% between SFT Data Ratio values of 0.0 and 0.8.
* (0.0, 0%), (0.1, ~10%), (0.2, ~20%), (0.3, ~40%), (0.4, ~60%), (0.5, ~75%), (0.6, ~90%), (0.7, ~95%), (0.8, ~100%), (0.9, ~100%), (1.0, ~100%)
* **n=4 (Green, Triangle marker, Dash-Dot Line):** The line increases gradually from 0% to approximately 80% between SFT Data Ratio values of 0.0 and 0.7, then continues to increase to 100%.
* (0.0, 0%), (0.1, ~10%), (0.2, ~20%), (0.3, ~30%), (0.4, ~40%), (0.5, ~50%), (0.6, ~65%), (0.7, ~80%), (0.8, ~90%), (0.9, ~95%), (1.0, ~100%)
### Key Observations
* When n=1, the exact match is always 100%, regardless of the SFT Data Ratio.
* As 'n' increases from 2 to 4, the SFT Data Ratio required to achieve a high exact match percentage also increases.
* The 'n=2' line shows the steepest increase in exact match percentage as the SFT Data Ratio increases.
### Interpretation
The chart demonstrates the impact of the 'n' parameter on the exact match percentage, given different SFT Data Ratios. A lower 'n' value (n=1) guarantees a 100% exact match, irrespective of the SFT Data Ratio. However, as 'n' increases, a higher SFT Data Ratio is needed to achieve a similar level of exact match. This suggests that 'n' influences the sensitivity of the exact match to the amount of SFT data used. The sharp increase for n=2 indicates a critical threshold in SFT Data Ratio for achieving high accuracy, while the gradual increase for n=3 and n=4 suggests a more proportional relationship.