## Line Graphs: PPL and Average Accuracy vs. Update Steps
### Overview
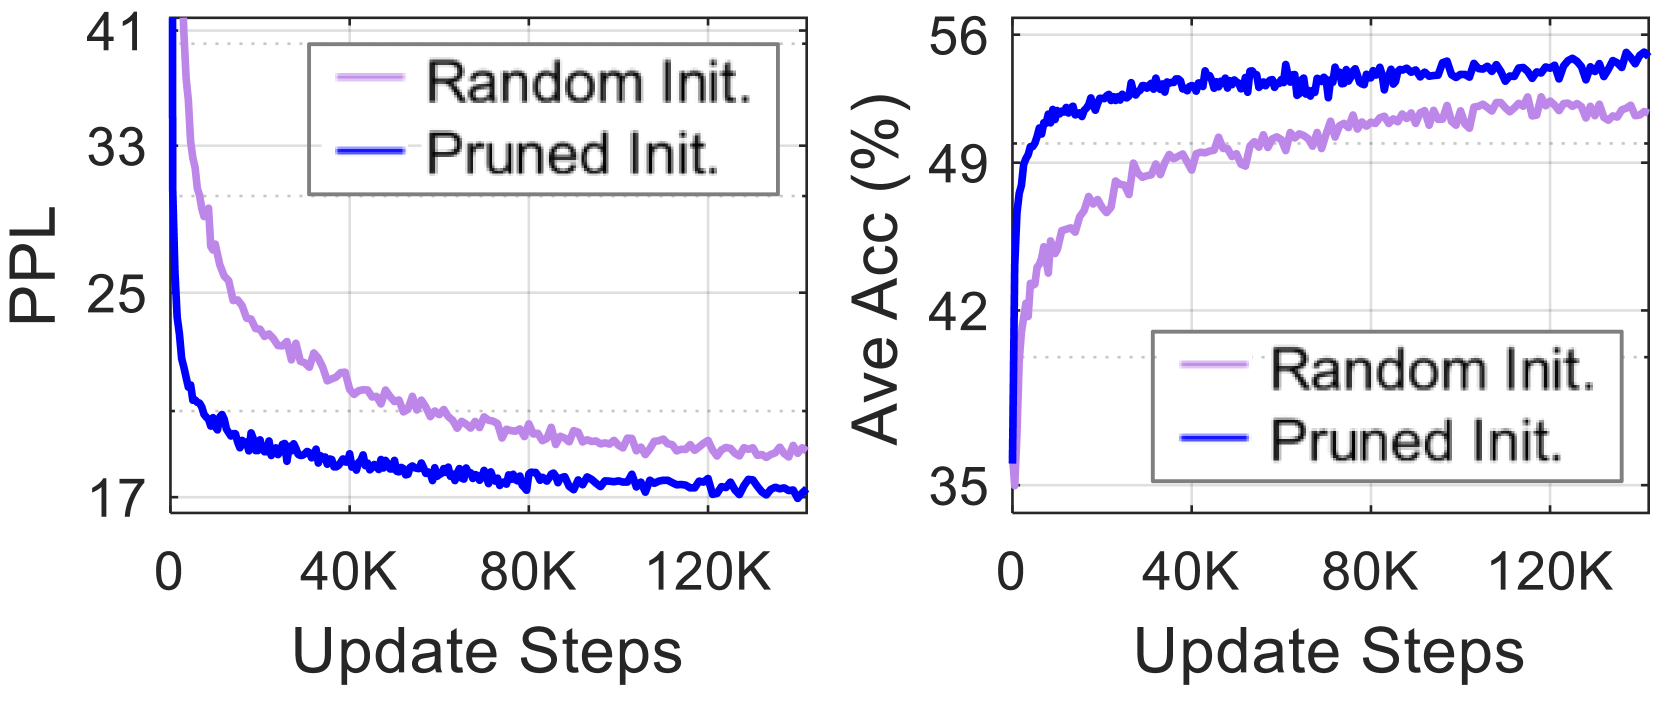
The image presents two line graphs side-by-side. The left graph displays Perplexity (PPL) against Update Steps, while the right graph shows Average Accuracy (Ave Acc) in percentage against Update Steps. Both graphs compare the performance of "Random Init." and "Pruned Init." methods.
### Components/Axes
**Left Graph (PPL vs. Update Steps):**
* **Y-axis:** Labeled "PPL" (Perplexity). Scale ranges from 17 to 41, with tick marks at 17, 25, 33, and 41.
* **X-axis:** Labeled "Update Steps". Scale ranges from 0 to 120K, with tick marks at 0, 40K, 80K, and 120K.
* **Legend (Top-Right):**
* "Random Init." - Represented by a light purple line.
* "Pruned Init." - Represented by a blue line.
**Right Graph (Ave Acc (%) vs. Update Steps):**
* **Y-axis:** Labeled "Ave Acc (%)" (Average Accuracy in percentage). Scale ranges from 35 to 56, with tick marks at 35, 42, 49, and 56.
* **X-axis:** Labeled "Update Steps". Scale ranges from 0 to 120K, with tick marks at 0, 40K, 80K, and 120K.
* **Legend (Center-Right):**
* "Random Init." - Represented by a light purple line.
* "Pruned Init." - Represented by a blue line.
### Detailed Analysis
**Left Graph (PPL vs. Update Steps):**
* **Random Init. (Light Purple):** The PPL starts at approximately 41 and decreases rapidly initially, then gradually levels off to around 19 after 120K update steps.
* At 0 Update Steps: PPL ≈ 41
* At 40K Update Steps: PPL ≈ 24
* At 80K Update Steps: PPL ≈ 20
* At 120K Update Steps: PPL ≈ 19
* **Pruned Init. (Blue):** The PPL starts at approximately 33 and decreases rapidly initially, then gradually levels off to around 17 after 120K update steps.
* At 0 Update Steps: PPL ≈ 33
* At 40K Update Steps: PPL ≈ 19
* At 80K Update Steps: PPL ≈ 17.5
* At 120K Update Steps: PPL ≈ 17
**Right Graph (Ave Acc (%) vs. Update Steps):**
* **Random Init. (Light Purple):** The average accuracy starts at approximately 35 and increases rapidly initially, then gradually levels off to around 51 after 120K update steps.
* At 0 Update Steps: Ave Acc ≈ 35
* At 40K Update Steps: Ave Acc ≈ 49
* At 80K Update Steps: Ave Acc ≈ 50
* At 120K Update Steps: Ave Acc ≈ 51
* **Pruned Init. (Blue):** The average accuracy starts at approximately 35 and increases rapidly initially, then gradually levels off to around 55 after 120K update steps.
* At 0 Update Steps: Ave Acc ≈ 35
* At 40K Update Steps: Ave Acc ≈ 53
* At 80K Update Steps: Ave Acc ≈ 54.5
* At 120K Update Steps: Ave Acc ≈ 55
### Key Observations
* In the PPL graph, "Pruned Init." consistently achieves lower PPL values compared to "Random Init." across all update steps.
* In the Average Accuracy graph, "Pruned Init." consistently achieves higher average accuracy values compared to "Random Init." across all update steps.
* Both methods show diminishing returns with increasing update steps, as the curves flatten out.
### Interpretation
The data suggests that "Pruned Init." is a more effective initialization method compared to "Random Init." for this particular task. "Pruned Init." leads to lower perplexity (better language modeling) and higher average accuracy. The rapid initial improvement in both metrics for both methods indicates that the initial learning phase is crucial, and further training provides diminishing returns. The consistent superiority of "Pruned Init." implies that pre-structuring the model through pruning allows for more efficient learning and better performance.