\n
## Line Charts: Perplexity (PPL) and Average Accuracy (Ave Acc) vs. Update Steps
### Overview
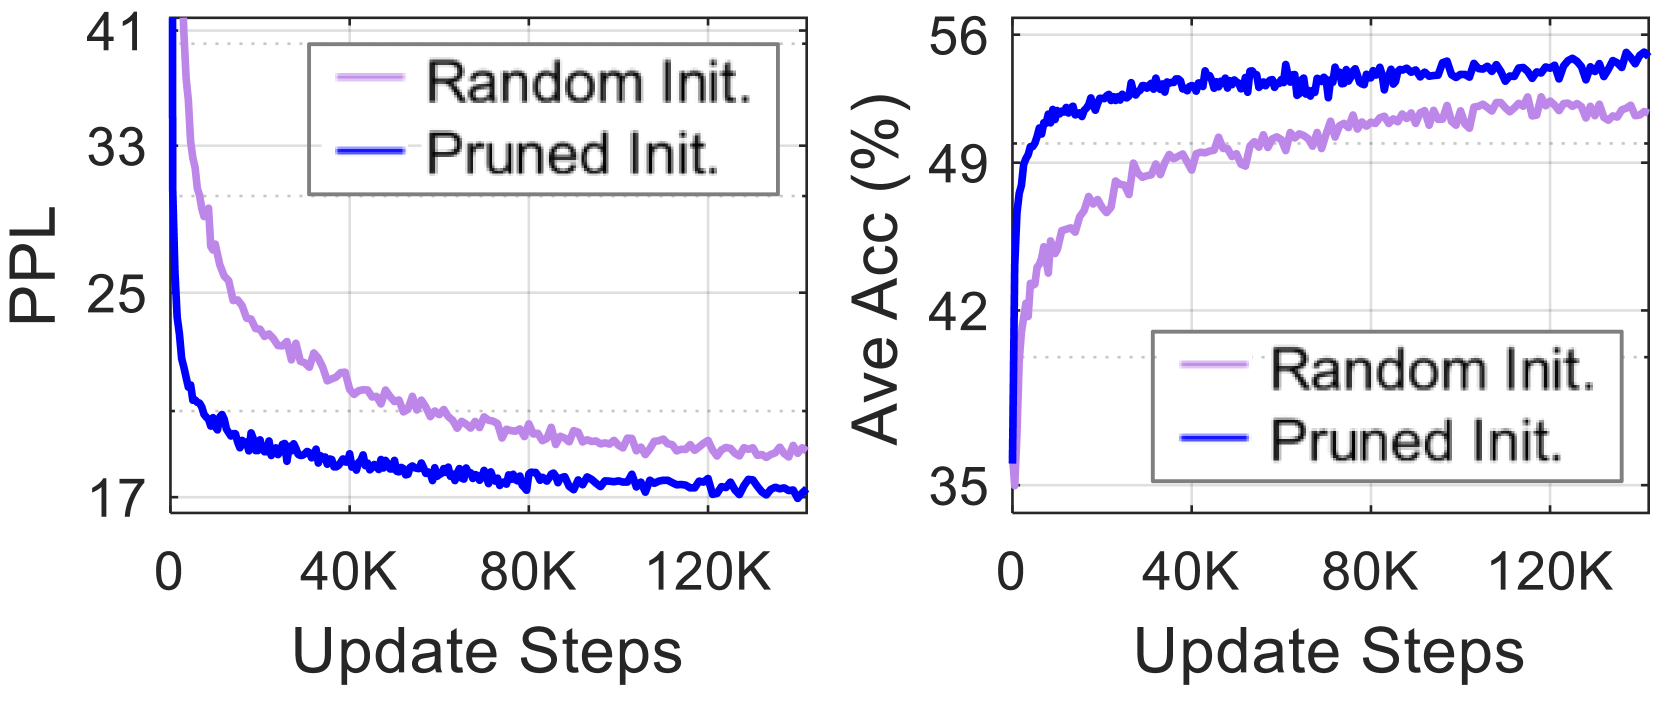
The image presents two line charts side-by-side. The left chart displays Perplexity (PPL) against Update Steps, while the right chart shows Average Accuracy (Ave Acc) in percentage (%) against Update Steps. Both charts compare the performance of two initialization methods: "Random Init." and "Pruned Init.".
### Components/Axes
**Left Chart (Perplexity):**
* **X-axis:** Update Steps (ranging from 0 to approximately 120,000)
* **Y-axis:** PPL (Perplexity, ranging from approximately 17 to 41)
* **Legend (top-right):**
* "Random Init." - represented by a light purple line.
* "Pruned Init." - represented by a dark blue line.
**Right Chart (Average Accuracy):**
* **X-axis:** Update Steps (ranging from 0 to approximately 120,000)
* **Y-axis:** Ave Acc (%) (Average Accuracy in percentage, ranging from approximately 35 to 56)
* **Legend (top-right):**
* "Random Init." - represented by a light purple line.
* "Pruned Init." - represented by a dark blue line.
### Detailed Analysis or Content Details
**Left Chart (Perplexity):**
The dark blue line ("Pruned Init.") starts at approximately 38 PPL at 0 Update Steps and rapidly decreases, reaching a plateau around 18 PPL at approximately 40K Update Steps. It fluctuates slightly between 17 and 19 PPL for the remainder of the observed Update Steps.
The light purple line ("Random Init.") starts at approximately 33 PPL at 0 Update Steps and also decreases, but at a slower rate than the "Pruned Init." line. It reaches a plateau around 19 PPL at approximately 40K Update Steps and fluctuates between 18 and 21 PPL for the remainder of the observed Update Steps.
**Right Chart (Average Accuracy):**
The dark blue line ("Pruned Init.") starts at approximately 42% Ave Acc at 0 Update Steps and steadily increases, reaching a plateau around 52% at approximately 40K Update Steps. It fluctuates slightly between 51 and 53% for the remainder of the observed Update Steps.
The light purple line ("Random Init.") starts at approximately 49% Ave Acc at 0 Update Steps and also increases, but at a slower rate than the "Pruned Init." line. It reaches a plateau around 50% at approximately 40K Update Steps and fluctuates between 48 and 51% for the remainder of the observed Update Steps.
### Key Observations
* "Pruned Init." consistently exhibits lower Perplexity (better performance) than "Random Init." across all Update Steps.
* "Pruned Init." consistently exhibits higher Average Accuracy than "Random Init." across all Update Steps.
* Both initialization methods appear to converge (reach a plateau) in performance after approximately 40,000 Update Steps.
* The rate of improvement is much faster for "Pruned Init." in the initial stages of training.
### Interpretation
The data suggests that "Pruned Init." is a more effective initialization method than "Random Init." for this particular task. The lower Perplexity and higher Average Accuracy indicate that models initialized with "Pruned Init." learn faster and achieve better performance. The convergence observed after 40,000 Update Steps suggests that further training beyond this point yields diminishing returns. The initial rapid improvement with "Pruned Init." could be attributed to a more informed starting point, potentially leveraging prior knowledge or a more efficient parameter space exploration. The consistent difference in performance between the two methods indicates a systematic advantage of "Pruned Init." rather than random fluctuations.