## [Dual-Panel Line Chart]: Training Performance Comparison of Random vs. Pruned Initialization
### Overview
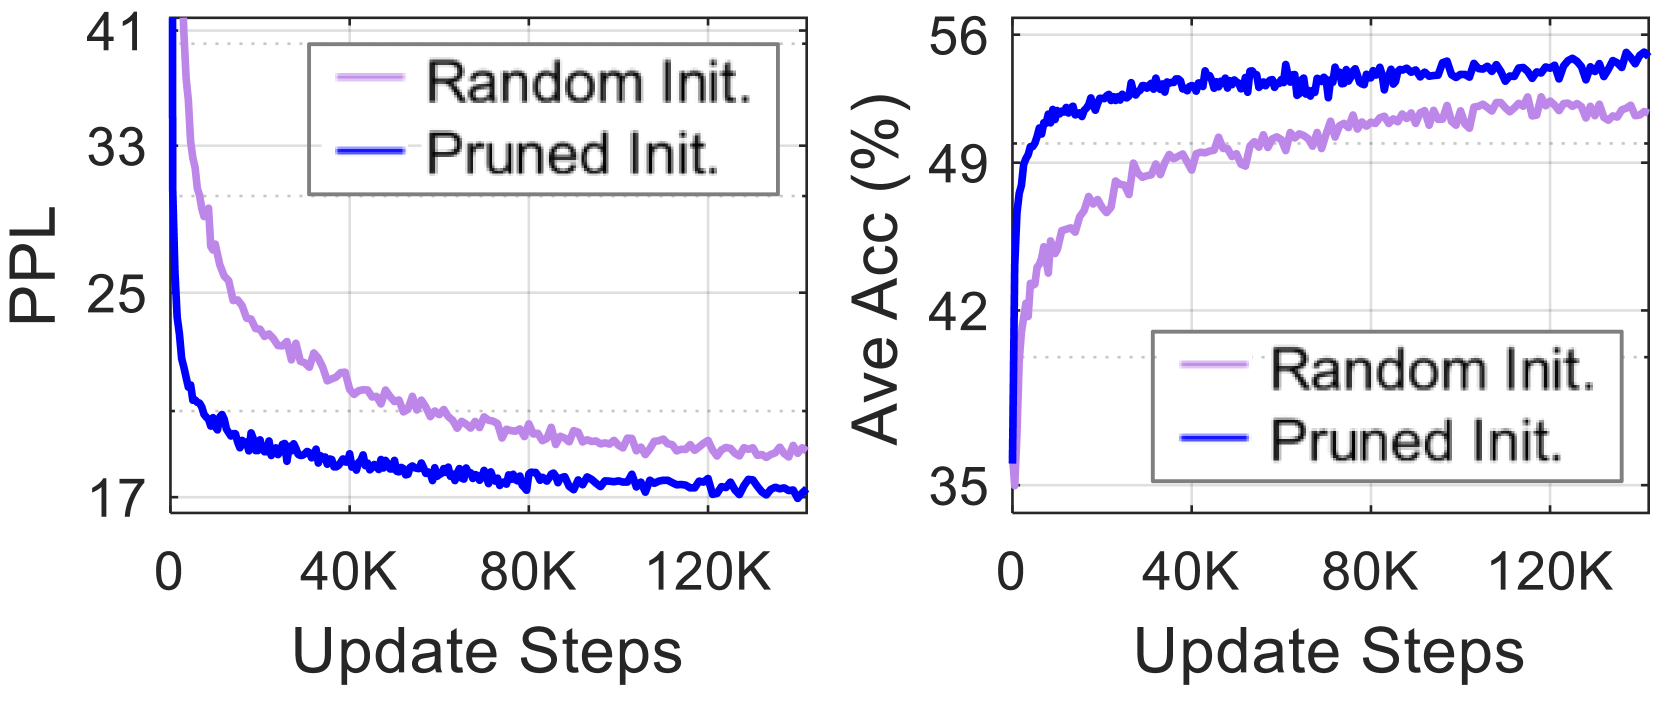
The image displays two side-by-side line charts comparing the training performance of two model initialization methods: "Random Init." and "Pruned Init." over the course of training steps. The left chart tracks Perplexity (PPL), a measure of prediction error, while the right chart tracks Average Accuracy (Ave Acc) as a percentage. Both charts share the same X-axis (Update Steps) and legend.
### Components/Axes
**Left Chart (PPL vs. Steps):**
* **Y-axis:** Label: "PPL". Scale: Linear, ranging from approximately 17 to 41. Major tick marks at 17, 25, 33, 41.
* **X-axis:** Label: "Update Steps". Scale: Linear, ranging from 0 to 120,000 (120K). Major tick marks at 0, 40K, 80K, 120K.
* **Legend:** Positioned in the top-left quadrant of the chart area. Contains two entries:
* "Random Init." - Represented by a light purple/lavender line.
* "Pruned Init." - Represented by a solid blue line.
**Right Chart (Ave Acc vs. Steps):**
* **Y-axis:** Label: "Ave Acc (%)". Scale: Linear, ranging from approximately 35% to 56%. Major tick marks at 35, 42, 49, 56.
* **X-axis:** Label: "Update Steps". Identical to the left chart (0 to 120K).
* **Legend:** Positioned in the bottom-right quadrant of the chart area. Identical entries and color coding as the left chart.
### Detailed Analysis
**Left Chart - Perplexity (PPL):**
* **Trend Verification:** Both lines show a steep initial decrease followed by a gradual leveling off, indicating learning and convergence. The "Pruned Init." (blue) line decreases more rapidly and maintains a lower value throughout.
* **Data Points (Approximate):**
* **Random Init. (Light Purple):** Starts above 41 at step 0. Drops to ~25 by 20K steps, ~21 by 60K steps, and ends near ~19 at 120K steps.
* **Pruned Init. (Blue):** Starts above 41 at step 0. Drops sharply to ~21 by 10K steps, ~19 by 40K steps, and ends near ~17 at 120K steps.
**Right Chart - Average Accuracy (Ave Acc %):**
* **Trend Verification:** Both lines show a steep initial increase followed by a gradual plateau, indicating improving model performance. The "Pruned Init." (blue) line increases more rapidly and maintains a higher accuracy throughout.
* **Data Points (Approximate):**
* **Random Init. (Light Purple):** Starts at ~35% at step 0. Rises to ~45% by 20K steps, ~50% by 60K steps, and ends near ~52% at 120K steps.
* **Pruned Init. (Blue):** Starts at ~35% at step 0. Rises sharply to ~50% by 10K steps, ~53% by 40K steps, and ends near ~55% at 120K steps.
### Key Observations
1. **Consistent Superiority:** The "Pruned Init." method (blue line) demonstrates superior performance on both metrics (lower PPL, higher Accuracy) compared to "Random Init." (light purple line) at every comparable point after initialization.
2. **Faster Convergence:** The "Pruned Init." curves show a steeper initial slope in both charts, indicating it learns and converges to a good solution significantly faster in the early stages of training (first ~20K steps).
3. **Performance Gap:** A consistent performance gap is maintained between the two methods throughout the displayed training period (120K steps). The gap appears slightly larger in the Accuracy chart than in the PPL chart.
4. **Noise:** Both lines exhibit minor fluctuations (noise), which is typical for training curves, but the overall trends are clear and distinct.
### Interpretation
The data strongly suggests that using a "Pruned Initialization" method provides a substantial advantage over standard random initialization for this specific model training task. The benefits are twofold:
1. **Improved Final Performance:** The model achieves a better final state, characterized by lower perplexity (better predictive likelihood) and higher average accuracy.
2. **Training Efficiency:** The model reaches a given performance level (e.g., 50% accuracy or PPL of 21) in far fewer update steps, which translates to reduced computational cost and training time.
The relationship between the two charts is complementary: the decrease in PPL (error) directly correlates with the increase in Accuracy (correctness). The "Pruned Init." method's ability to drive both metrics more effectively from the start implies that the pruning process likely identifies and preserves a more optimal subnetwork or parameter structure within the model, providing a better starting point for the optimization process. This is a clear demonstration of the value of intelligent initialization strategies in machine learning.