\n
## Diagram: Network Representation
### Overview
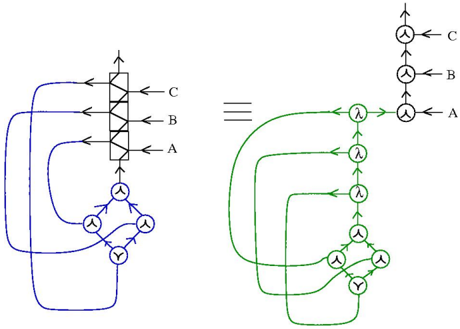
The image presents a diagram illustrating two network representations, one on the left in blue and one on the right in green. The two diagrams are visually equated with a triple equals sign ("==="). Both diagrams depict a similar structure involving nodes connected by directed edges, with a central component resembling a processing unit or a series of branching points. The diagrams appear to represent a transformation or equivalence between two different network architectures.
### Components/Axes
The diagrams consist of the following components:
* **Nodes:** Represented by circles. Some nodes have a "Y" symbol inside, and others have a lambda symbol ("λ").
* **Processing Unit:** A rectangular block with vertical lines inside, representing a series of operations or transformations.
* **Directed Edges:** Arrows indicating the flow of information or connections between nodes and the processing unit.
* **Labels:** "A", "B", and "C" are used to label the input/output connections to the processing unit.
### Detailed Analysis or Content Details
**Left Diagram (Blue):**
* The processing unit is positioned centrally.
* Three inputs labeled "A", "B", and "C" enter the processing unit from the left.
* The output from the processing unit connects to a branching structure consisting of three nodes with "Y" symbols.
* A feedback loop connects the output of the branching structure back to the input of the processing unit.
* The connections are represented by curved blue lines.
**Right Diagram (Green):**
* The diagram consists of a series of nodes with lambda symbols ("λ") connected in a chain.
* The chain of lambda nodes connects to a branching structure similar to the left diagram, with three nodes containing "Y" symbols.
* The inputs labeled "A", "B", and "C" enter the network at the top, connecting to individual lambda nodes.
* A feedback loop connects the output of the branching structure back to the chain of lambda nodes.
* The connections are represented by curved green lines.
### Key Observations
* The diagrams are structurally similar, suggesting an equivalence in functionality.
* The processing unit in the left diagram is replaced by a chain of lambda nodes in the right diagram.
* The labels "A", "B", and "C" are consistently used in both diagrams, indicating corresponding inputs/outputs.
* The feedback loops are present in both diagrams, suggesting a recurrent or iterative process.
### Interpretation
The diagram likely represents a transformation of a network architecture. The left diagram, with its processing unit, could represent a more abstract or high-level representation of a computation. The right diagram, with its chain of lambda nodes, could represent a more concrete or low-level implementation of the same computation. The lambda nodes likely represent functional operations, and the chain represents a sequence of these operations. The equivalence indicated by the "===" suggests that the two diagrams are functionally equivalent, meaning they perform the same computation despite having different structures. The feedback loops suggest that the computation is iterative or recurrent, potentially involving learning or adaptation. The labels "A", "B", and "C" likely represent input parameters or signals to the network. The diagram could be illustrating a process of unfolding or expanding a compact representation into a more detailed one, or vice versa. The use of lambda calculus is suggested by the "λ" symbols, indicating a functional programming approach to network design.