## Line Chart: Loss Trends During Training
### Overview
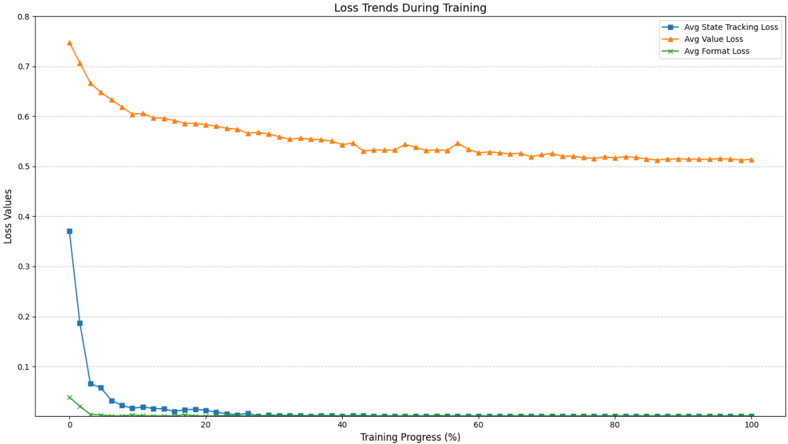
The chart visualizes three loss metrics tracked during a training process, plotted against training progress percentage (0-100%). The y-axis represents loss values (0-0.8), while the x-axis shows training progress. Three distinct data series are represented by color-coded lines: blue (Avg State Tracking Loss), orange (Avg Value Loss), and green (Avg Format Loss).
### Components/Axes
- **Title**: "Loss Trends During Training"
- **X-axis**: "Training Progress (%)" with markers at 0, 20, 40, 60, 80, 100.
- **Y-axis**: "Loss Values" with increments of 0.1 (0.0 to 0.8).
- **Legend**: Located in the top-right corner, mapping:
- Blue: Avg State Tracking Loss
- Orange: Avg Value Loss
- Green: Avg Format Loss
### Detailed Analysis
1. **Avg State Tracking Loss (Blue Line)**:
- Starts at **~0.37** at 0% training progress.
- Drops sharply to **~0.01** by 10% training progress.
- Remains near-zero for the remainder of the training (0.01-0.02 range).
2. **Avg Value Loss (Orange Line)**:
- Begins at **~0.75** at 0% training progress.
- Gradually declines to **~0.51** by 100% training progress.
- Shows minor fluctuations (e.g., slight peaks at ~0.53 between 40-60% training).
3. **Avg Format Loss (Green Line)**:
- Remains consistently near **~0.005** throughout training.
- No significant variation observed.
### Key Observations
- **Rapid Improvement in State Tracking**: The blue line’s steep decline indicates a quick reduction in state tracking errors early in training.
- **Steady Value Loss Reduction**: The orange line’s gradual decline suggests slower but consistent improvement in value-related losses.
- **Negligible Format Loss**: The green line’s near-zero value implies format loss was not a significant factor during training.
### Interpretation
The data suggests the model prioritizes resolving state tracking errors early, achieving near-optimal performance in this metric by 10% training progress. Value loss, while decreasing steadily, remains the dominant loss component throughout training, indicating it may be a more complex or persistent challenge. The near-zero format loss implies the model’s formatting mechanisms were either inherently robust or not a focus of the training process. The divergence between the blue and orange lines highlights differing learning dynamics: state tracking improves rapidly, while value loss requires sustained effort. This could reflect architectural choices, data complexity, or optimization priorities in the training setup.