## Diagram: Category Theory Morphisms
### Overview
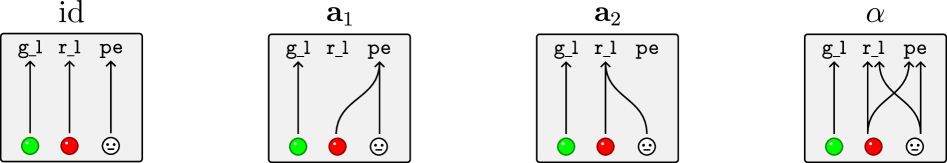
The image presents four diagrams illustrating different morphisms in a category theory context. Each diagram is contained within a rounded rectangle and depicts the transformation of three inputs (represented by colored circles at the bottom) to three outputs (labeled at the top). The diagrams are labeled "id", "a₁", "a₂", and "α".
### Components/Axes
Each diagram has the following components:
* **Title:** Located above the rounded rectangle, identifying the morphism (id, a₁, a₂, α).
* **Inputs:** Three circles at the bottom of the rectangle, representing the inputs. The circles are colored green, red, and white (with a smiley face inside).
* **Outputs:** Three labels at the top of the rectangle, representing the outputs: "g\_l", "r\_l", and "pe".
* **Arrows/Lines:** Lines connecting the inputs to the outputs, indicating the transformation or mapping. These lines can be straight or curved.
### Detailed Analysis
**1. Diagram "id" (Identity Morphism):**
* **Title:** id
* **Inputs:** Green circle, Red circle, White circle (smiley face)
* **Outputs:** g\_l, r\_l, pe
* **Mapping:**
* Green circle connects to g\_l with a straight arrow.
* Red circle connects to r\_l with a straight arrow.
* White circle connects to pe with a straight arrow.
* **Trend:** Each input maps directly to its corresponding output.
**2. Diagram "a₁":**
* **Title:** a₁
* **Inputs:** Green circle, Red circle, White circle (smiley face)
* **Outputs:** g\_l, r\_l, pe
* **Mapping:**
* Green circle connects to g\_l with a straight arrow.
* Red circle connects to pe with a curved arrow.
* White circle connects to r\_l with a curved arrow.
* **Trend:** The red and white inputs are swapped in their mapping to the r\_l and pe outputs.
**3. Diagram "a₂":**
* **Title:** a₂
* **Inputs:** Green circle, Red circle, White circle (smiley face)
* **Outputs:** g\_l, r\_l, pe
* **Mapping:**
* Green circle connects to r\_l with a curved arrow.
* Red circle connects to g\_l with a curved arrow.
* White circle connects to pe with a straight arrow.
* **Trend:** The green and red inputs are swapped in their mapping to the g\_l and r\_l outputs.
**4. Diagram "α":**
* **Title:** α
* **Inputs:** Green circle, Red circle, White circle (smiley face)
* **Outputs:** g\_l, r\_l, pe
* **Mapping:**
* Green circle connects to g\_l with a straight arrow.
* Red circle connects to pe with a curved arrow.
* White circle connects to r\_l with a curved arrow.
* **Trend:** The red and white inputs are swapped in their mapping to the r\_l and pe outputs.
### Key Observations
* The "id" diagram represents the identity morphism, where each input is directly mapped to its corresponding output.
* The "a₁", "a₂", and "α" diagrams represent different non-identity morphisms, where the inputs are rearranged or transformed in their mapping to the outputs.
* The inputs are consistently represented by the same colors (green, red, white) across all diagrams.
* The outputs are consistently labeled as "g\_l", "r\_l", and "pe" across all diagrams.
### Interpretation
The diagrams illustrate different types of morphisms in a category theory context. The "id" morphism represents the simplest case, where the inputs are unchanged. The "a₁", "a₂", and "α" morphisms represent more complex transformations, where the inputs are rearranged or combined in some way. These diagrams are likely used to visually represent the relationships between objects and morphisms in a specific category. The specific meaning of "g\_l", "r\_l", and "pe" would depend on the context of the category being represented. The diagrams likely represent some kind of algebraic structure or computation.