\n
## Diagram: Genetic Interaction Models
### Overview
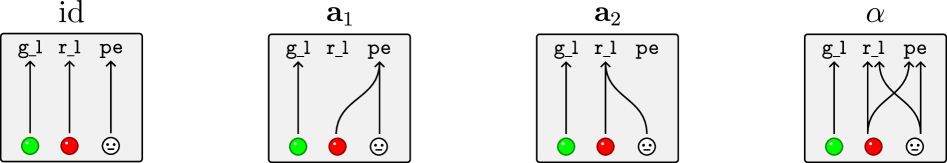
The image presents four diagrams illustrating different genetic interaction models. Each diagram depicts the relationship between a genotype and a phenotype, represented by arrows connecting colored circles to a smiley/frowning face. The diagrams are labeled "id", "a₁", "a₂", and "α".
### Components/Axes
Each diagram contains the following components:
* **Labels:** "id", "a₁", "a₂", "α" – identifying each interaction model.
* **Genotype Indicators:** Two colored circles:
* Green circle: Represents a functional allele.
* Red circle: Represents a non-functional allele.
* **Phenotype Indicator:** A smiley or frowning face, representing a positive or negative phenotype, respectively.
* **Arrows:** Indicate the influence of the genotype on the phenotype. The labels next to the arrows are: "g l", "r l", "pe".
### Detailed Analysis or Content Details
**Diagram "id" (Identity):**
* The green circle has three arrows pointing upwards to the smiley face.
* The red circle has three arrows pointing upwards to the smiley face.
* This indicates that both the functional and non-functional alleles result in a positive phenotype.
**Diagram "a₁" (Additive):**
* The green circle has two arrows pointing upwards to the smiley face.
* The red circle has one arrow pointing upwards to the smiley face.
* This suggests that the functional allele contributes more to the positive phenotype than the non-functional allele.
**Diagram "a₂" (Dominance):**
* The green circle has three arrows pointing upwards to the smiley face.
* The red circle has one arrow pointing upwards to the smiley face.
* This indicates that the functional allele completely masks the effect of the non-functional allele, resulting in a positive phenotype.
**Diagram "α" (Epistasis):**
* The green circle has two arrows pointing upwards to the smiley face and one arrow pointing downwards to the frowning face.
* The red circle has one arrow pointing upwards to the smiley face and two arrows pointing downwards to the frowning face.
* This suggests a complex interaction where the effect of one allele depends on the presence of another, leading to both positive and negative phenotypes.
### Key Observations
* The number of arrows connecting each allele to the phenotype varies across the diagrams, indicating different degrees of influence.
* The "id" model shows identical effects from both alleles, while the other models demonstrate varying contributions.
* The "α" model exhibits the most complex interaction, with both alleles influencing both phenotypes.
### Interpretation
The diagrams illustrate fundamental concepts in genetics, specifically how different allele combinations can lead to different phenotypes. The models represent different types of genetic interactions: identity, additivity, dominance, and epistasis. These interactions are crucial for understanding the complexity of inheritance and the relationship between genotype and phenotype. The diagrams are simplified representations, but they effectively convey the core principles of each interaction type. The arrows represent the contribution of each allele to the final phenotype. The "α" model, epistasis, is particularly important as it demonstrates that genes do not always act independently and that the effect of one gene can be modified by other genes.