## Diagram: Four Interaction Configurations Between Goal, Reward, and Policy
### Overview
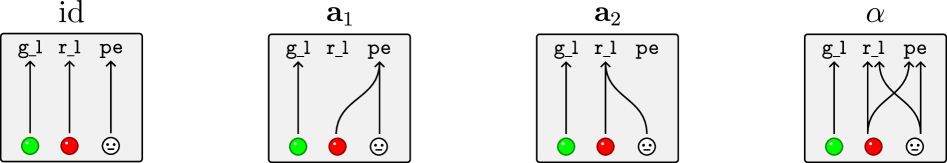
The image displays four schematic diagrams arranged horizontally, each illustrating a different configuration of relationships between three core components. The diagrams are labeled from left to right as: **id**, **a₁**, **a₂**, and **α**. Each diagram uses a consistent set of symbols: three vertical arrows labeled `g_l`, `r_l`, and `pe`, originating from colored circles at the bottom. The primary variation between diagrams is the presence and direction of curved connecting lines between these components, indicating different interaction or dependency patterns.
### Components/Axes
* **Titles (Top of each box):** `id`, `a₁`, `a₂`, `α`
* **Component Labels (Top of arrows):** `g_l`, `r_l`, `pe`
* **Base Symbols (Bottom of arrows):**
* A **green circle** at the base of the `g_l` arrow.
* A **red circle** at the base of the `r_l` arrow.
* A **smiley face icon** at the base of the `pe` arrow.
* **Spatial Layout:** Each configuration is contained within a rectangular box. The three arrows are evenly spaced within each box. The connecting lines are drawn as smooth curves between the arrow shafts or bases.
### Detailed Analysis
**Diagram 1: `id` (Leftmost)**
* **Configuration:** All three components are independent.
* **Flow:** Three straight, parallel vertical arrows (`g_l`, `r_l`, `pe`) point upward from their respective base symbols. There are no connecting lines between them.
**Diagram 2: `a₁` (Second from left)**
* **Configuration:** The `pe` component influences or connects to the `r_l` component.
* **Flow:** The `g_l` arrow remains straight and independent. A curved line originates from the `pe` arrow's shaft and connects downward to the **red circle** at the base of the `r_l` arrow. The `r_l` arrow itself remains straight.
**Diagram 3: `a₂` (Third from left)**
* **Configuration:** The `r_l` component influences or connects to the `pe` component.
* **Flow:** The `g_l` arrow remains straight and independent. A curved line originates from the `r_l` arrow's shaft and connects downward to the **smiley face icon** at the base of the `pe` arrow. The `pe` arrow itself remains straight.
**Diagram 4: `α` (Rightmost)**
* **Configuration:** A bidirectional or crossed interaction between `r_l` and `pe`.
* **Flow:** The `g_l` arrow remains straight and independent. Two curved lines cross each other:
1. One line originates from the `r_l` arrow's shaft and connects to the **smiley face icon** at the base of the `pe` arrow.
2. Another line originates from the `pe` arrow's shaft and connects to the **red circle** at the base of the `r_l` arrow.
### Key Observations
1. **Consistent Element:** The `g_l` (green circle) component is always depicted as an independent, straight vertical arrow in all four configurations.
2. **Variable Interaction:** The core variation is in the relationship between `r_l` (red circle) and `pe` (smiley face). The diagrams progress from no interaction (`id`), to one-way influence from `pe` to `r_l` (`a₁`), to one-way influence from `r_l` to `pe` (`a₂`), and finally to a mutual or crossed interaction (`α`).
3. **Visual Encoding:** The use of color (green, red) and an icon (smiley face) provides immediate visual distinction between the three component types. The curved lines explicitly denote a directional relationship or flow of influence.
### Interpretation
This diagram set likely illustrates different models or architectures for how a learning or decision-making system processes information. The labels are suggestive:
* `g_l` could stand for "goal" or "guidance signal."
* `r_l` could stand for "reward" or "reinforcement signal."
* `pe` could stand for "policy" or "prediction error."
The configurations demonstrate a progression of complexity in how the reward signal (`r_l`) and the policy/prediction (`pe`) interact:
* **`id` (Independent):** The reward and policy are processed separately, with no direct feedback loop. This might represent a baseline or non-interactive system.
* **`a₁` (Policy affects Reward):** The policy's output directly influences the reward signal. This could model a system where the agent's actions shape its own reward environment.
* **`a₂` (Reward affects Policy):** The reward signal directly updates the policy. This is a classic reinforcement learning setup where rewards guide policy improvement.
* **`α` (Mutual Interaction):** The reward and policy are fully coupled, each influencing the other. This represents the most complex, integrated system, potentially modeling advanced adaptive or co-evolutionary learning processes where the agent and its evaluation criteria dynamically shape each other.
The consistent independence of `g_l` suggests it is an external, fixed objective or target that the interacting `r_l`-`pe` system operates upon. The diagrams effectively visualize the structural differences between these four conceptual models.