## Bar Chart: SWE-bench Verified
### Overview
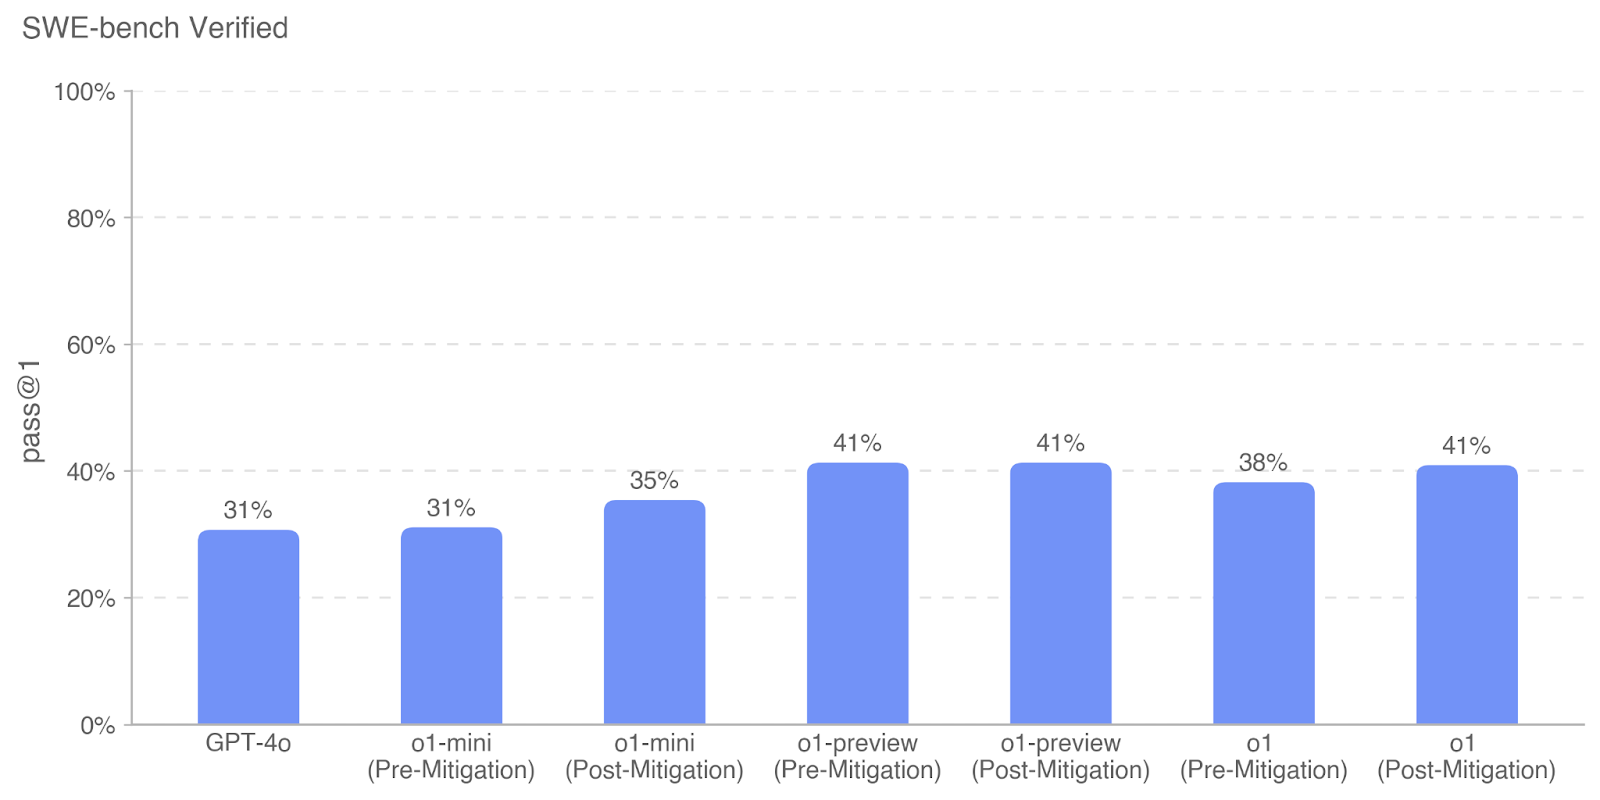
The image is a bar chart titled "SWE-bench Verified". It compares the "pass@1" rate of different models and configurations, including GPT-4o, o1-mini, o1-preview, and o1, both before and after mitigation strategies were applied. The y-axis represents the pass rate, ranging from 0% to 100%, and the x-axis represents the different models and configurations.
### Components/Axes
* **Title:** SWE-bench Verified
* **Y-axis:** "pass@1" with a scale from 0% to 100% in increments of 20%.
* **X-axis:** Categorical axis representing different models and configurations:
* GPT-4o
* o1-mini (Pre-Mitigation)
* o1-mini (Post-Mitigation)
* o1-preview (Pre-Mitigation)
* o1-preview (Post-Mitigation)
* o1 (Pre-Mitigation)
* o1 (Post-Mitigation)
* **Bars:** Each bar represents the "pass@1" rate for a specific model/configuration. All bars are light blue.
### Detailed Analysis
Here's a breakdown of the "pass@1" rates for each category:
* **GPT-4o:** 31%
* **o1-mini (Pre-Mitigation):** 31%
* **o1-mini (Post-Mitigation):** 35%
* **o1-preview (Pre-Mitigation):** 41%
* **o1-preview (Post-Mitigation):** 41%
* **o1 (Pre-Mitigation):** 38%
* **o1 (Post-Mitigation):** 41%
### Key Observations
* The "pass@1" rate for GPT-4o is 31%.
* Applying mitigation strategies to "o1-mini" increases the "pass@1" rate from 31% to 35%.
* "o1-preview" has a "pass@1" rate of 41% both before and after mitigation.
* Applying mitigation strategies to "o1" increases the "pass@1" rate from 38% to 41%.
* "o1-preview" shows the highest "pass@1" rate among all configurations.
### Interpretation
The bar chart illustrates the impact of mitigation strategies on the "pass@1" rate of different models. The data suggests that applying mitigation strategies generally improves the performance of the models, as seen with "o1-mini" and "o1". However, in the case of "o1-preview", the mitigation strategy does not seem to have any effect on the "pass@1" rate. The GPT-4o model has the lowest pass rate. The "o1-preview" model has the highest pass rate.