## Bar Chart: SWE-bench Verified Performance
### Overview
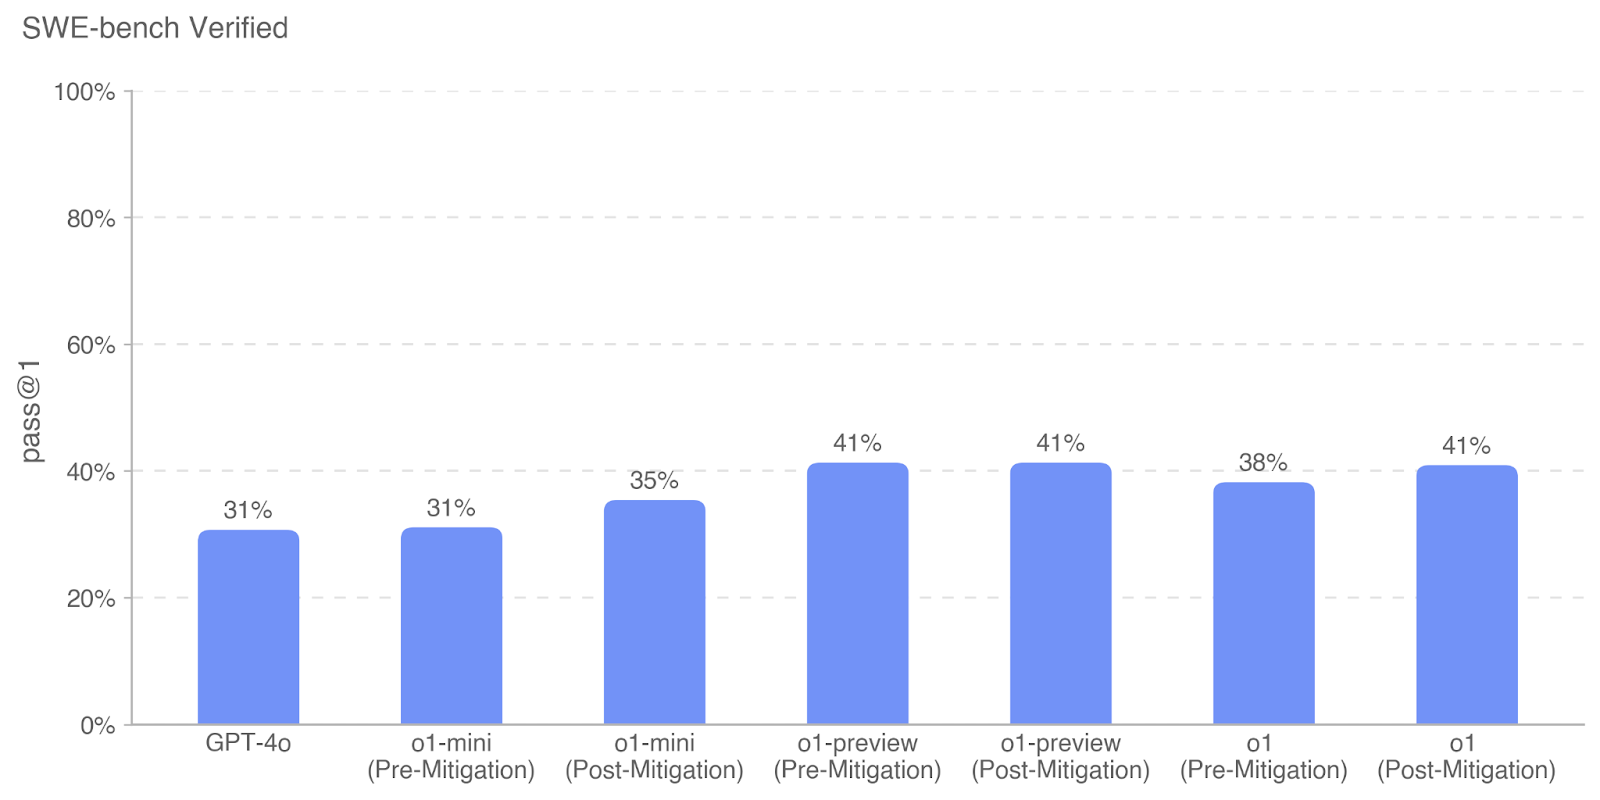
This is a vertical bar chart titled "SWE-bench Verified" that compares the performance of several AI models on a software engineering benchmark. The chart measures the "pass @1" rate, which is the percentage of problems solved correctly on the first attempt. It includes a baseline model (GPT-4o) and three model families (o1-mini, o1-preview, o1), each shown in both "Pre-Mitigation" and "Post-Mitigation" states.
### Components/Axes
* **Title:** "SWE-bench Verified" (located at the top-left of the chart area).
* **Y-Axis:**
* **Label:** "pass @1" (rotated vertically on the left side).
* **Scale:** Linear scale from 0% to 100%, with major gridlines and labels at 0%, 20%, 40%, 60%, 80%, and 100%.
* **X-Axis:**
* **Categories (from left to right):**
1. GPT-4o
2. o1-mini (Pre-Mitigation)
3. o1-mini (Post-Mitigation)
4. o1-preview (Pre-Mitigation)
5. o1-preview (Post-Mitigation)
6. o1 (Pre-Mitigation)
7. o1 (Post-Mitigation)
* **Data Series:** A single series represented by solid blue bars. There is no separate legend, as the x-axis labels define each bar.
* **Data Labels:** The exact percentage value is displayed above each bar.
### Detailed Analysis
The chart presents the following performance data:
| Model & State | pass @1 (Approx. Value) |
| :--- | :--- |
| GPT-4o | 31% |
| o1-mini (Pre-Mitigation) | 31% |
| o1-mini (Post-Mitigation) | 35% |
| o1-preview (Pre-Mitigation) | 41% |
| o1-preview (Post-Mitigation) | 41% |
| o1 (Pre-Mitigation) | 38% |
| o1 (Post-Mitigation) | 41% |
**Visual Trend Verification:**
* The bar for **GPT-4o** is the shortest, establishing a baseline.
* The **o1-mini** bars show a slight upward slope from Pre-Mitigation (31%) to Post-Mitigation (35%).
* The **o1-preview** bars are of equal height (41%), showing no change between Pre- and Post-Mitigation states.
* The **o1** bars show an upward slope from Pre-Mitigation (38%) to Post-Mitigation (41%).
* The highest performance (41%) is achieved by three bars: o1-preview (both states) and o1 (Post-Mitigation).
### Key Observations
1. **Performance Ceiling:** The highest observed pass@1 rate is 41%, achieved by multiple models.
2. **Mitigation Impact:** The effect of "mitigation" varies by model family:
* **o1-mini:** Shows a clear, positive improvement of +4 percentage points.
* **o1-preview:** Shows no measurable change in performance.
* **o1:** Shows a positive improvement of +3 percentage points.
3. **Model Comparison:** The o1-preview model family starts at a higher baseline (41%) than o1-mini (31%) and o1 (38%). The Post-Mitigation o1 model matches the performance of the o1-preview models.
4. **Baseline:** GPT-4o and the Pre-Mitigation o1-mini model share the lowest performance at 31%.
### Interpretation
This chart demonstrates the comparative effectiveness of different AI models on a standardized software engineering task (SWE-bench). The data suggests that the "o1-preview" model architecture has a higher inherent capability for this task than "o1-mini" or the base "o1" model, as evidenced by its higher pre-mitigation score.
The term "mitigation" likely refers to a technique applied to reduce harmful outputs or improve safety alignment. The key finding is that this mitigation process has a **non-uniform impact** across model variants:
* It provides a measurable performance boost for the "o1-mini" and "o1" models.
* It does not degrade the performance of the "o1-preview" model, which is a significant result, as safety mitigations can sometimes reduce capability.
The convergence of the Post-Mitigation "o1" model to the 41% score of the "o1-preview" models suggests that the mitigation process may help the "o1" model reach its full potential on this benchmark. The chart ultimately argues that it is possible to apply safety mitigations without sacrificing—and in some cases even while improving—performance on complex technical tasks like software engineering.