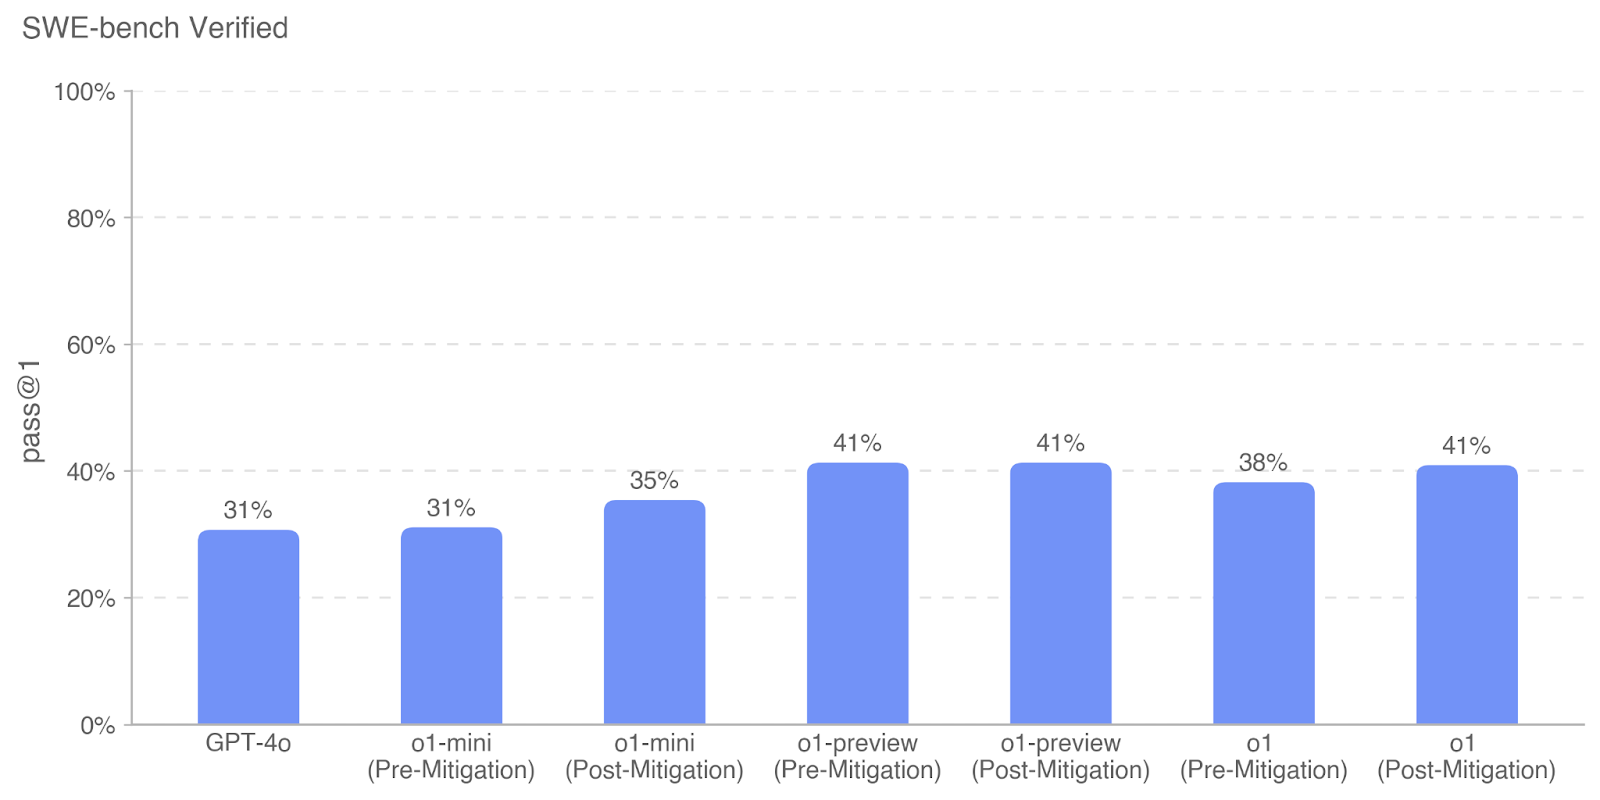
## Bar Chart: SWE-bench Verified Performance by Model and Mitigation Stage
### Overview
The chart compares the "pass@1" performance (percentage) of different AI models on the SWE-bench Verified benchmark, segmented by pre- and post-mitigation stages. All values are represented as blue bars with percentage labels on top.
### Components/Axes
- **X-axis (Categories)**:
- GPT-4o
- o1-mini (Pre-Mitigation)
- o1-mini (Post-Mitigation)
- o1-preview (Pre-Mitigation)
- o1-preview (Post-Mitigation)
- o1 (Pre-Mitigation)
- o1 (Post-Mitigation)
- **Y-axis (Scale)**:
- Labeled "pass@1" with increments from 0% to 100% in 20% steps.
- **Legend**: Not visible in the image.
- **Bar Colors**: All bars are uniformly blue.
### Detailed Analysis
1. **GPT-4o**:
- Single bar at 31% (no post-mitigation data provided).
2. **o1-mini**:
- Pre-Mitigation: 31%
- Post-Mitigation: 35% (increase of 4 percentage points).
3. **o1-preview**:
- Pre-Mitigation: 41%
- Post-Mitigation: 41% (no change).
4. **o1**:
- Pre-Mitigation: 38%
- Post-Mitigation: 41% (increase of 3 percentage points).
### Key Observations
- **Post-Mitigation Improvements**:
- All models with both pre- and post-mitigation data show performance gains except o1-preview, which remains unchanged.
- **Highest Performance**:
- o1-preview and o1 (post-mitigation) achieve the highest pass@1 rate at 41%.
- **GPT-4o Limitation**:
- Only pre-mitigation data is available (31%), preventing comparison with post-mitigation results.
### Interpretation
The data suggests that mitigation strategies generally enhance model performance on SWE-bench Verified tasks. Notably:
- **o1-mini** and **o1** show measurable improvements post-mitigation, indicating effective optimization.
- **o1-preview**'s stagnant performance implies its mitigation process may have already maximized potential or introduced no further gains.
- The absence of GPT-4o's post-mitigation data creates a gap in evaluating its full potential.
This analysis highlights the importance of mitigation in refining AI model efficacy, with o1-preview and o1 emerging as top performers after optimization.