\n
## Bar Chart: Accuracy vs. Pass@1 of qτ
### Overview
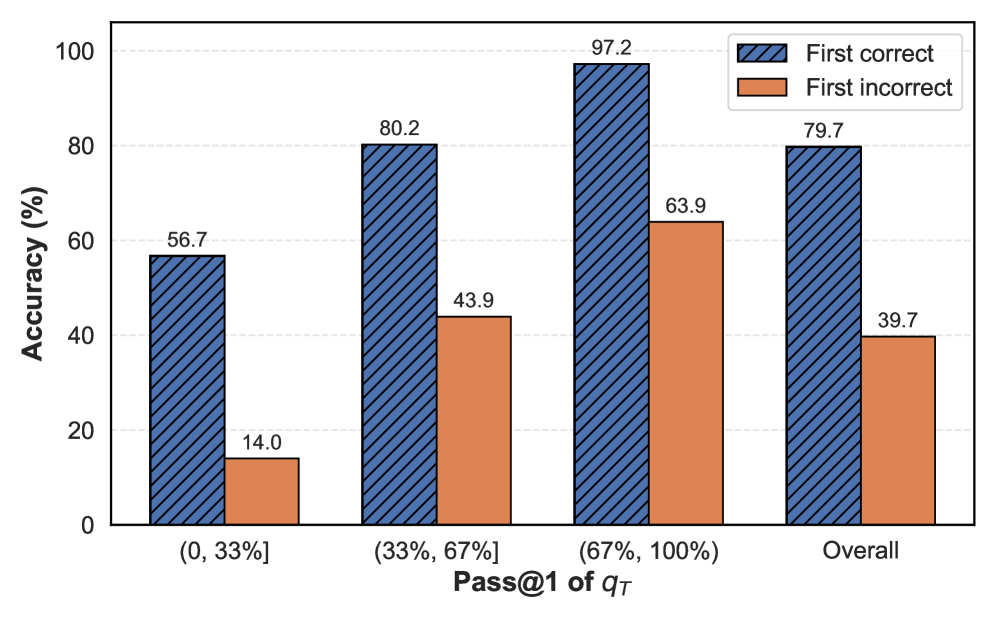
This bar chart displays the accuracy of "First correct" and "First incorrect" predictions across different ranges of Pass@1 of qτ. The x-axis represents the Pass@1 of qτ ranges, and the y-axis represents the accuracy in percentage. The chart uses paired bars for each Pass@1 range, with blue bars representing "First correct" and orange bars representing "First incorrect". An "Overall" accuracy is also presented.
### Components/Axes
* **X-axis Title:** Pass@1 of qτ
* **X-axis Categories:** (0, 33%], (33%, 67], (67%, 100%), Overall
* **Y-axis Title:** Accuracy (%)
* **Y-axis Scale:** 0 to 100, with increments of 20.
* **Legend:**
* Blue (hatched): First correct
* Orange: First incorrect
### Detailed Analysis
The chart consists of four sets of paired bars, plus an overall accuracy comparison.
* **(0, 33%] Pass@1 of qτ:**
* First correct: Approximately 56.7% accuracy.
* First incorrect: Approximately 14.0% accuracy.
* **(33%, 67%] Pass@1 of qτ:**
* First correct: Approximately 80.2% accuracy.
* First incorrect: Approximately 43.9% accuracy.
* **(67%, 100%] Pass@1 of qτ:**
* First correct: Approximately 97.2% accuracy.
* First incorrect: Approximately 63.9% accuracy.
* **Overall:**
* First correct: Approximately 79.7% accuracy.
* First incorrect: Approximately 39.7% accuracy.
The "First correct" bars consistently show a higher accuracy than the "First incorrect" bars across all Pass@1 ranges. The accuracy of "First correct" increases as the Pass@1 of qτ increases.
### Key Observations
* There is a strong positive correlation between Pass@1 of qτ and the accuracy of "First correct" predictions.
* The accuracy of "First incorrect" predictions remains relatively low across all Pass@1 ranges.
* The largest difference in accuracy between "First correct" and "First incorrect" occurs in the (67%, 100%] Pass@1 range.
* The overall accuracy of "First correct" is 79.7%, while the overall accuracy of "First incorrect" is 39.7%.
### Interpretation
The data suggests that the model's ability to provide the correct answer on the first attempt (First correct) improves significantly as the Pass@1 of qτ increases. Pass@1 of qτ likely represents a measure of confidence or quality of the initial predictions. Higher Pass@1 values indicate a higher probability that the first prediction is correct. The substantial gap between "First correct" and "First incorrect" accuracy indicates that the model is more reliable when it has higher confidence in its initial predictions. The overall accuracy reflects the combined performance across all Pass@1 ranges, and the difference between the overall "First correct" and "First incorrect" accuracies highlights the model's overall effectiveness. The chart demonstrates a clear trade-off: higher confidence in initial predictions leads to significantly improved accuracy. This could be due to the model refining its predictions based on the initial Pass@1 score, or it could indicate that the initial Pass@1 score is a good proxy for the overall quality of the prediction.