## Grouped Bar Chart: Accuracy by Pass@1 of q_T
### Overview
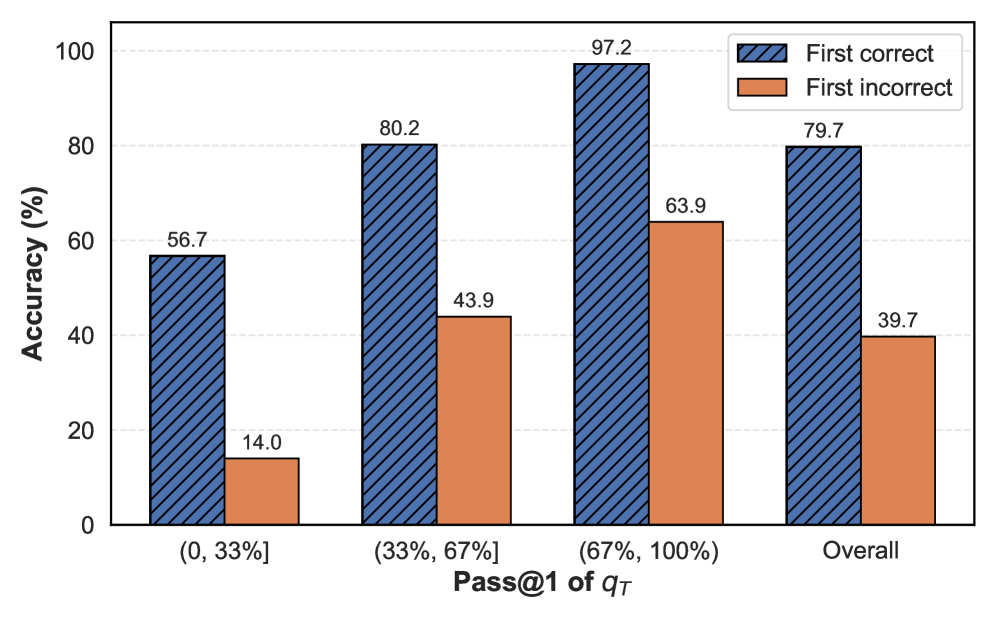
This is a grouped bar chart comparing the accuracy percentage of two conditions ("First correct" and "First incorrect") across four categories defined by the "Pass@1 of q_T" metric. The chart visually demonstrates how initial correctness correlates with subsequent accuracy.
### Components/Axes
* **Chart Type:** Grouped bar chart.
* **Y-Axis:** Labeled "Accuracy (%)". Scale runs from 0 to 100 in increments of 20.
* **X-Axis:** Labeled "Pass@1 of q_T". Contains four categorical groups:
1. `(0, 33%]`
2. `(33%, 67%]`
3. `(67%, 100%]`
4. `Overall`
* **Legend:** Located in the top-right corner of the chart area.
* **Blue bar with diagonal hatching (\\):** "First correct"
* **Solid orange bar:** "First incorrect"
* **Data Labels:** Numerical accuracy values are printed directly above each bar.
### Detailed Analysis
The chart presents the following data points for each category:
**1. Category: (0, 33%]**
* **First correct (Blue, hatched):** 56.7%
* **First incorrect (Orange, solid):** 14.0%
* **Trend:** A large disparity exists. The "First correct" condition has an accuracy over 4 times higher than the "First incorrect" condition.
**2. Category: (33%, 67%]**
* **First correct (Blue, hatched):** 80.2%
* **First incorrect (Orange, solid):** 43.9%
* **Trend:** Both accuracies increase compared to the previous category. The gap remains substantial, with "First correct" being nearly double the accuracy of "First incorrect".
**3. Category: (67%, 100%]**
* **First correct (Blue, hatched):** 97.2%
* **First incorrect (Orange, solid):** 63.9%
* **Trend:** This category shows the highest accuracies for both conditions. "First correct" approaches near-perfect accuracy. The absolute gap between the two conditions is the largest here (33.3 percentage points).
**4. Category: Overall**
* **First correct (Blue, hatched):** 79.7%
* **First incorrect (Orange, solid):** 39.7%
* **Trend:** The "Overall" performance aggregates the previous categories. The "First correct" accuracy (79.7%) is very close to the value in the (33%, 67%] range, while the "First incorrect" accuracy (39.7%) is lower than its value in the same range.
### Key Observations
1. **Consistent Performance Gap:** In every category, the "First correct" condition yields significantly higher accuracy than the "First incorrect" condition.
2. **Positive Correlation with Pass@1:** For both conditions, accuracy increases as the "Pass@1 of q_T" metric increases from the lowest to the highest bracket.
3. **Non-Linear Aggregation:** The "Overall" accuracy for "First incorrect" (39.7%) is lower than its accuracy in the middle (33%, 67%] bracket (43.9%), suggesting the low accuracy in the (0, 33%] bracket heavily influences the aggregate.
4. **Peak Performance:** The highest observed accuracy is 97.2% for "First correct" in the (67%, 100%] bracket.
### Interpretation
The data strongly suggests that the "Pass@1 of q_T" metric is a powerful predictor of accuracy. A higher Pass@1 score is associated with better performance for both conditions. More critically, the condition of being "First correct" is itself a dominant factor, consistently leading to much higher accuracy than being "First incorrect," regardless of the Pass@1 bracket.
The "Overall" figures indicate that across all cases, an initial correct response ("First correct") is associated with an accuracy of approximately 80%, while an initial incorrect response ("First incorrect") halves that likelihood to about 40%. This implies a strong path-dependency or momentum effect: starting correctly sets a trajectory for sustained accuracy, while starting incorrectly makes recovery to a correct answer much less probable. The chart does not reveal causation—it's unclear if being "First correct" *causes* higher subsequent accuracy or if both are symptoms of an underlying factor like task ease or model capability—but the correlation is stark and consistent.