\n
## Radar Chart: AI Model Performance Comparison
### Overview
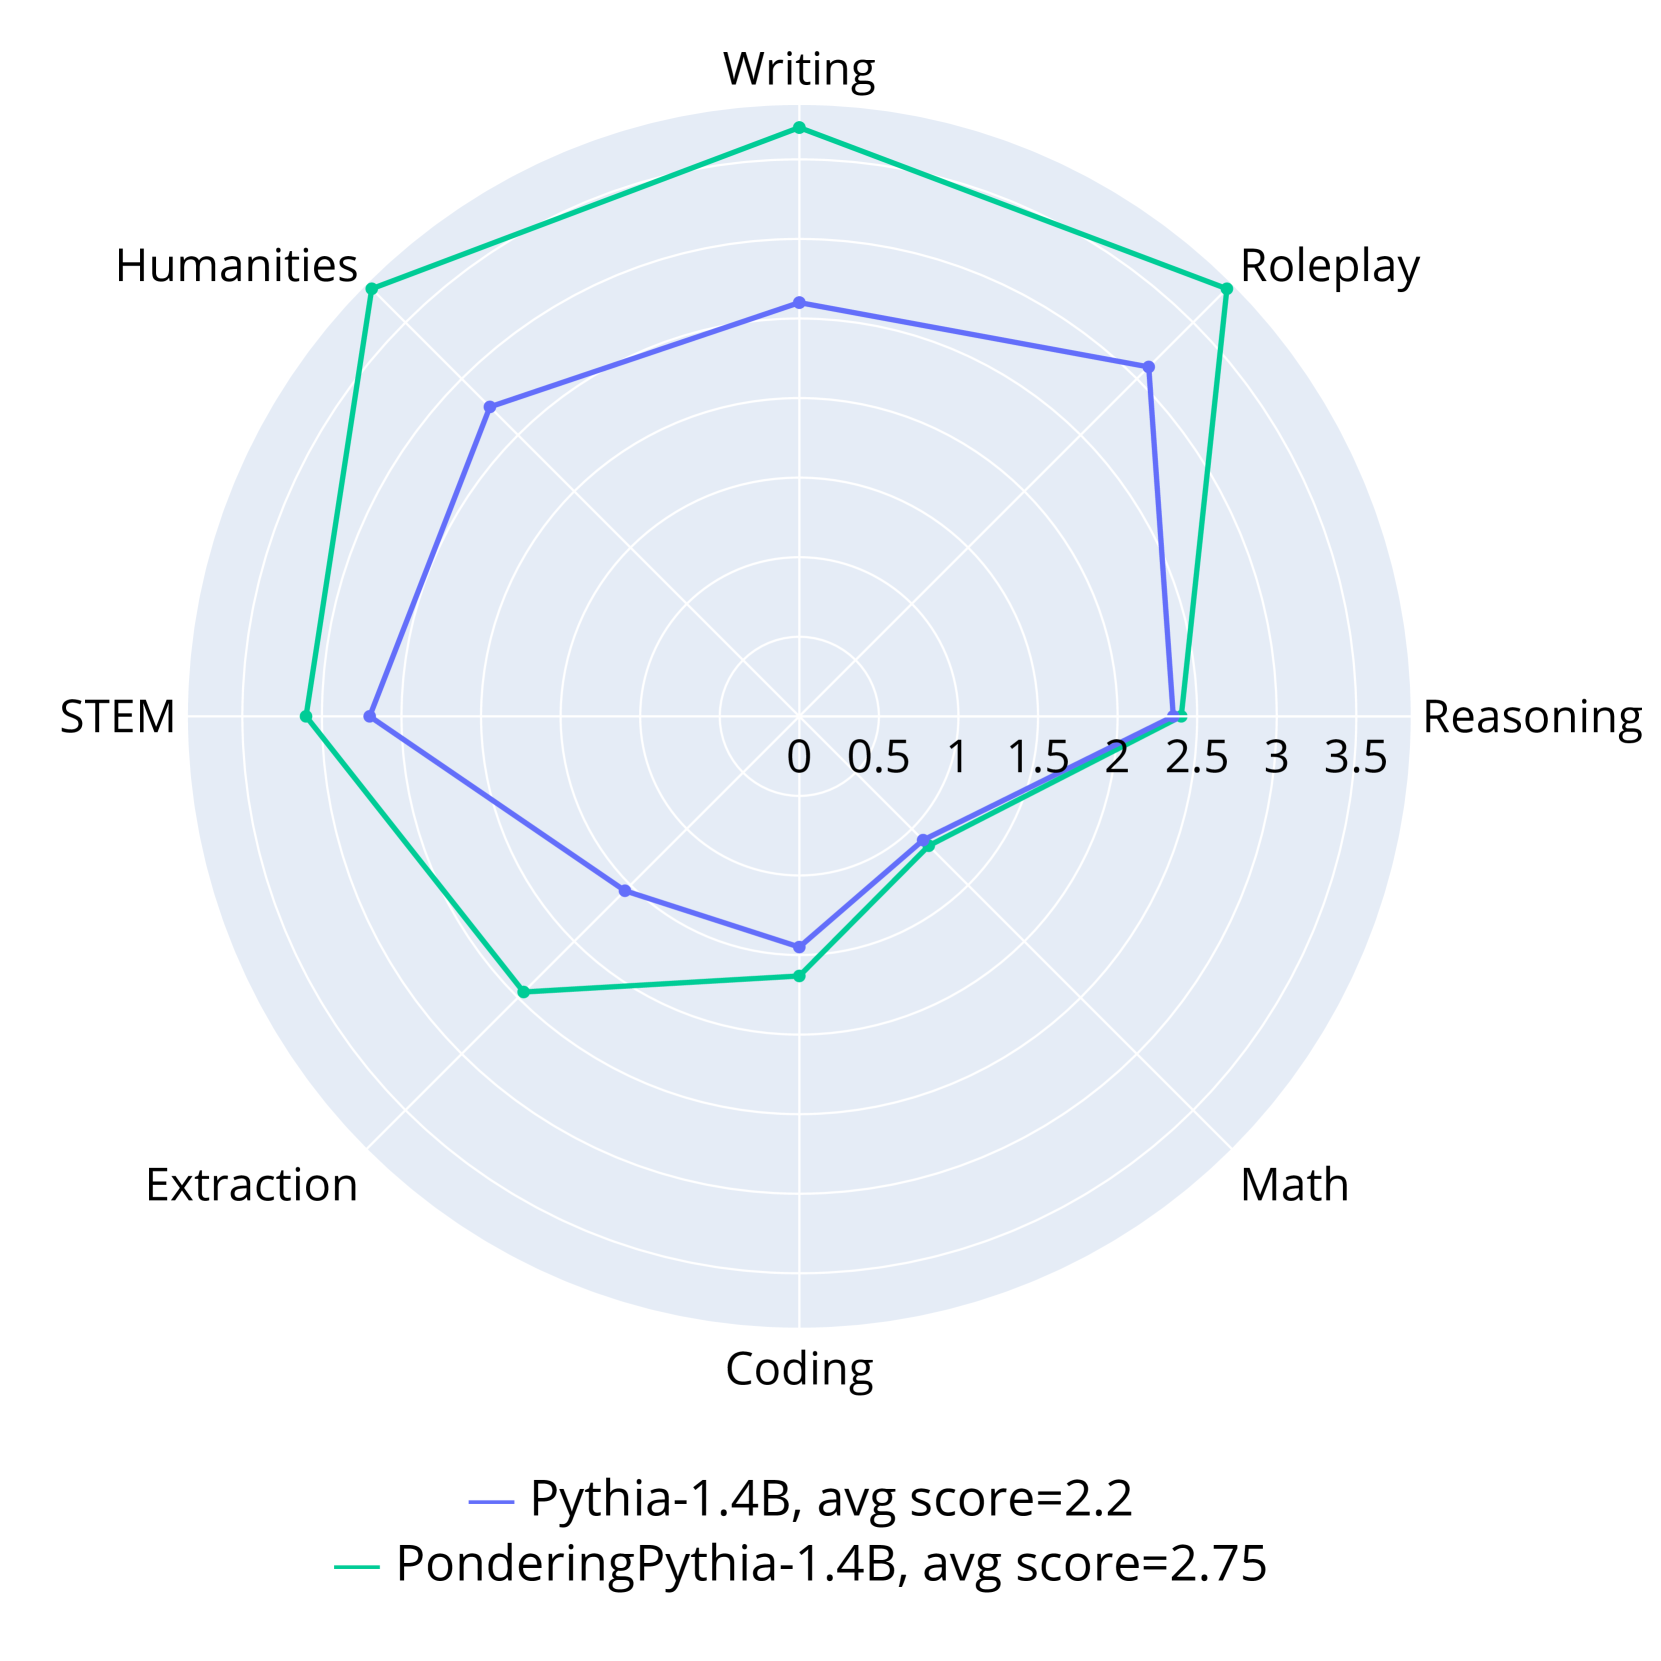
This image is a radar chart (spider plot) comparing the performance of two AI language models across eight distinct capability categories. The chart visualizes how each model scores on a radial scale, allowing for a direct comparison of their strengths and weaknesses.
### Components/Axes
* **Chart Type:** Radar Chart (Spider Plot)
* **Categories (Axes):** Eight axes radiate from the center, each representing a capability domain. Listed clockwise from the top:
1. Writing
2. Roleplay
3. Reasoning
4. Math
5. Coding
6. Extraction
7. STEM
8. Humanities
* **Radial Scale:** Concentric circles represent the scoring scale, marked from the center (0) outward to the edge (3.5). Major grid lines are at intervals of 0.5 (0, 0.5, 1, 1.5, 2, 2.5, 3, 3.5).
* **Legend:** Located at the bottom center of the chart.
* **Blue Line:** `Pythia-1.4B, avg score=2.2`
* **Green Line:** `PonderingPythia-1.4B, avg score=2.75`
### Detailed Analysis
**Data Series 1: Pythia-1.4B (Blue Line)**
* **Visual Trend:** The blue polygon is generally contained within the green one, indicating lower overall performance. Its shape is somewhat irregular, with a pronounced peak in the Reasoning category.
* **Approximate Data Points (Category: Score):**
* Writing: ~2.0
* Roleplay: ~2.3
* Reasoning: ~2.5 (This is its highest point)
* Math: ~2.0
* Coding: ~1.5
* Extraction: ~1.8
* STEM: ~2.2
* Humanities: ~2.0
**Data Series 2: PonderingPythia-1.4B (Green Line)**
* **Visual Trend:** The green polygon encompasses a larger area than the blue one, indicating superior overall performance (as confirmed by the higher average score). It shows strong, broad performance in creative and humanities-related tasks.
* **Approximate Data Points (Category: Score):**
* Writing: ~3.0
* Roleplay: ~3.0
* Reasoning: ~2.4 (Slightly lower than Pythia-1.4B)
* Math: ~2.1
* Coding: ~1.7
* Extraction: ~2.3
* STEM: ~2.8
* Humanities: ~3.0
### Key Observations
1. **Performance Gap:** PonderingPythia-1.4B (avg 2.75) demonstrates a clear and consistent performance advantage over Pythia-1.4B (avg 2.2) in 7 out of 8 categories.
2. **Category Strengths:** PonderingPythia excels most in **Writing**, **Roleplay**, and **Humanities**, scoring at or near the 3.0 mark. Pythia's strongest category is **Reasoning**.
3. **Notable Anomaly:** The **Reasoning** axis is the only category where Pythia-1.4B (blue) appears to score marginally higher than PonderingPythia-1.4B (green).
4. **Shared Weakness:** Both models show their lowest performance in the **Coding** and **Extraction** categories, with scores below 2.0 for Pythia and below 2.5 for PonderingPythia.
5. **Spatial Relationship:** The green line is positioned outside the blue line for nearly the entire chart, visually reinforcing its superior average performance. The lines converge and nearly intersect at the Reasoning axis.
### Interpretation
The data suggests that the "Pondering" enhancement applied to the base Pythia-1.4B model yields significant improvements across a wide range of capabilities, particularly in tasks involving creativity, language nuance, and broad knowledge (Writing, Roleplay, Humanities, STEM). This indicates the modification successfully boosts general language understanding and generation.
However, the enhancement does not uniformly improve all skills. The near-parity and slight reversal in the **Reasoning** category is a critical finding. It implies that the "pondering" mechanism might introduce a trade-off, potentially optimizing for breadth or fluency at a minor cost to pure logical or deductive reasoning speed or accuracy. The persistent relative weakness in **Coding** and **Extraction** for both models points to a fundamental challenge in these structured, precise tasks that the "pondering" modification does not fully address.
In summary, the chart illustrates a successful model enhancement that creates a more capable and well-rounded AI, with the interesting caveat that gains in creative and knowledge-based domains may come with a negligible to slight cost in focused reasoning tasks. The visualization effectively argues for the value of the "Pondering" approach while also highlighting specific areas for future investigation and improvement.