## Line Graphs: Cross Sections of Convex Function
### Overview
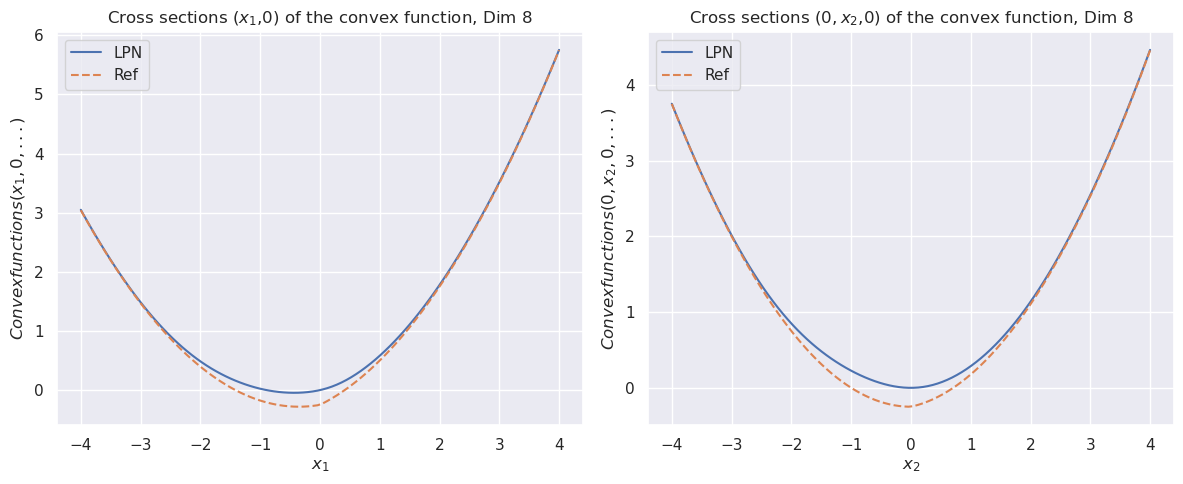
The image presents two line graphs, each displaying cross-sections of a convex function in 8 dimensions. The left graph shows the cross-section (x1, 0), while the right graph shows (0, x2, 0). Each graph plots two data series: "LPN" and "Ref," allowing for a comparison of their behavior across the x-axis.
### Components/Axes
* **Titles:**
* Left Graph: "Cross sections (x1,0) of the convex function, Dim 8"
* Right Graph: "Cross sections (0, x2,0) of the convex function, Dim 8"
* **Y-Axis:**
* Left Graph: "Convexfunctions(x1, 0, ...)"
* Right Graph: "Convexfunctions(0, x2, 0, ...)"
* Scale: 0 to 6 (left) and 0 to 4 (right), with tick marks at every integer value.
* **X-Axis:**
* Left Graph: "x1"
* Right Graph: "x2"
* Scale: -4 to 4, with tick marks at every integer value.
* **Legend:** Located in the top-left corner of each graph.
* "LPN": Solid blue line
* "Ref": Dashed orange line
### Detailed Analysis
**Left Graph: Cross sections (x1,0)**
* **LPN (Solid Blue Line):**
* Trend: The line forms a U-shape, decreasing from x1 = -4 to a minimum around x1 = -0.5, then increasing to x1 = 4.
* Data Points:
* x1 = -4, Convexfunctions(x1, 0, ...) ≈ 3
* x1 = -2, Convexfunctions(x1, 0, ...) ≈ 0.5
* x1 = 0, Convexfunctions(x1, 0, ...) ≈ 0
* x1 = 2, Convexfunctions(x1, 0, ...) ≈ 1
* x1 = 4, Convexfunctions(x1, 0, ...) ≈ 5.7
* **Ref (Dashed Orange Line):**
* Trend: Similar U-shape to LPN, but with a slightly lower minimum value.
* Data Points:
* x1 = -4, Convexfunctions(x1, 0, ...) ≈ 3
* x1 = -2, Convexfunctions(x1, 0, ...) ≈ 0
* x1 = 0, Convexfunctions(x1, 0, ...) ≈ -0.2
* x1 = 2, Convexfunctions(x1, 0, ...) ≈ 1.2
* x1 = 4, Convexfunctions(x1, 0, ...) ≈ 5.7
**Right Graph: Cross sections (0, x2,0)**
* **LPN (Solid Blue Line):**
* Trend: The line forms a U-shape, decreasing from x2 = -4 to a minimum around x2 = -0.5, then increasing to x2 = 4.
* Data Points:
* x2 = -4, Convexfunctions(0, x2, 0, ...) ≈ 3.7
* x2 = -2, Convexfunctions(0, x2, 0, ...) ≈ 0.5
* x2 = 0, Convexfunctions(0, x2, 0, ...) ≈ 0
* x2 = 2, Convexfunctions(0, x2, 0, ...) ≈ 1
* x2 = 4, Convexfunctions(0, x2, 0, ...) ≈ 4.5
* **Ref (Dashed Orange Line):**
* Trend: Similar U-shape to LPN, but with a slightly lower minimum value.
* Data Points:
* x2 = -4, Convexfunctions(0, x2, 0, ...) ≈ 3.7
* x2 = -2, Convexfunctions(0, x2, 0, ...) ≈ 0
* x2 = 0, Convexfunctions(0, x2, 0, ...) ≈ -0.2
* x2 = 2, Convexfunctions(0, x2, 0, ...) ≈ 1.2
* x2 = 4, Convexfunctions(0, x2, 0, ...) ≈ 4.5
### Key Observations
* Both graphs show similar U-shaped curves for LPN and Ref, indicating a convex function.
* The "Ref" line consistently has a slightly lower minimum value than the "LPN" line in both graphs.
* The left graph has a higher maximum y-value than the right graph.
### Interpretation
The graphs illustrate cross-sections of a convex function in 8 dimensions, comparing the behavior of "LPN" and a reference ("Ref") implementation. The similarity in the U-shaped curves suggests that "LPN" closely approximates the convex function, with minor differences reflected in the slightly higher minimum values compared to "Ref". The different cross-sections (x1, 0) and (0, x2, 0) show similar behavior, but the (x1, 0) cross-section has a higher range of values. This could indicate that the function varies more along the x1 dimension than the x2 dimension.