## Chart: Cross Sections of a Convex Function
### Overview
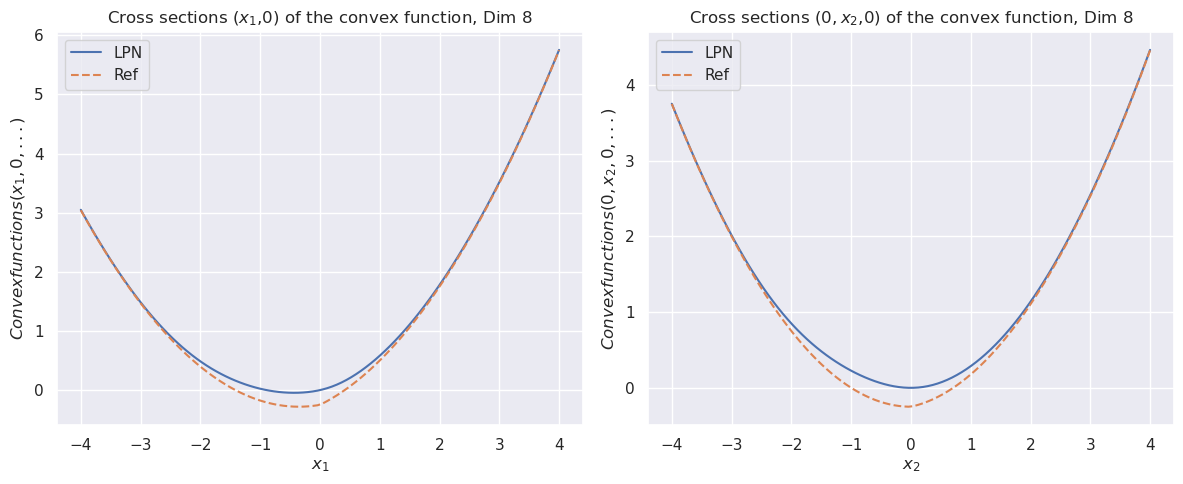
The image presents two separate charts, arranged side-by-side. Both charts depict cross-sections of a convex function in 8 dimensions. The left chart shows the cross-section along the x1 axis, while the right chart shows the cross-section along the x2 axis. Each chart displays two curves representing different methods ("LPN" and "Ref"). Both charts share a similar visual style and scale.
### Components/Axes
Each chart has the following components:
* **Title:** "Cross sections (x1,0,0,...) of the convex function, Dim 8" (left chart) and "Cross sections (0, x2,0,0...) of the convex function, Dim 8" (right chart).
* **X-axis:** Labeled "x1" (left chart) and "x2" (right chart), ranging from approximately -4 to 4.
* **Y-axis:** Labeled "Convexfunctions(x1, 0, ...)" (left chart) and "Convexfunctions(0, x2, 0, ...)" (right chart), ranging from approximately 0 to 6 (left chart) and 0 to 4 (right chart).
* **Legend:** Located in the top-left corner of each chart.
* "LPN" - Represented by a solid blue line.
* "Ref" - Represented by a dashed red line.
### Detailed Analysis or Content Details
**Left Chart (x1 cross-section):**
* **LPN (Solid Blue Line):** The line exhibits a parabolic shape, opening upwards. It reaches a minimum value near x1 = 0, with a value of approximately 0. The line increases symmetrically on both sides of the minimum.
* At x1 = -4, the value is approximately 5.5.
* At x1 = -2, the value is approximately 2.5.
* At x1 = 0, the value is approximately 0.
* At x1 = 2, the value is approximately 2.5.
* At x1 = 4, the value is approximately 5.5.
* **Ref (Dashed Red Line):** This line is almost identical to the LPN line, exhibiting the same parabolic shape and values. It is difficult to distinguish the two lines visually.
**Right Chart (x2 cross-section):**
* **LPN (Solid Blue Line):** Similar to the left chart, this line also forms a parabola opening upwards. It reaches a minimum value near x2 = 0, with a value of approximately 0. The line increases symmetrically on both sides of the minimum.
* At x2 = -4, the value is approximately 3.5.
* At x2 = -2, the value is approximately 1.5.
* At x2 = 0, the value is approximately 0.
* At x2 = 2, the value is approximately 1.5.
* At x2 = 4, the value is approximately 3.5.
* **Ref (Dashed Red Line):** Again, this line is nearly indistinguishable from the LPN line, following the same parabolic shape and values.
### Key Observations
* Both charts show a clear parabolic relationship between the input variable (x1 or x2) and the convex function value.
* The "LPN" and "Ref" methods produce almost identical results for both cross-sections. The lines are so close that it is difficult to differentiate them visually.
* The minimum value of the convex function appears to be 0 in both cross-sections, occurring at x1 = 0 and x2 = 0, respectively.
* The scale of the y-axis is different between the two charts.
### Interpretation
The charts demonstrate the behavior of a convex function in 8 dimensions when viewed along two specific axes (x1 and x2). The fact that the "LPN" and "Ref" methods yield nearly identical results suggests that they are converging to the same solution or representing the same underlying function. The parabolic shape confirms the function's convexity, indicating that any local minimum is also a global minimum. The different y-axis scales suggest that the function's sensitivity to changes in x1 and x2 may differ. The charts provide a visual representation of the function's curvature and its behavior in these two dimensions, which could be useful for understanding its overall properties and optimizing algorithms that rely on it. The near-identical lines suggest a high degree of consistency between the two methods, potentially indicating robustness or a well-defined problem space.