## [Chart Type]: Dual Line Plots of Convex Function Cross-Sections
### Overview
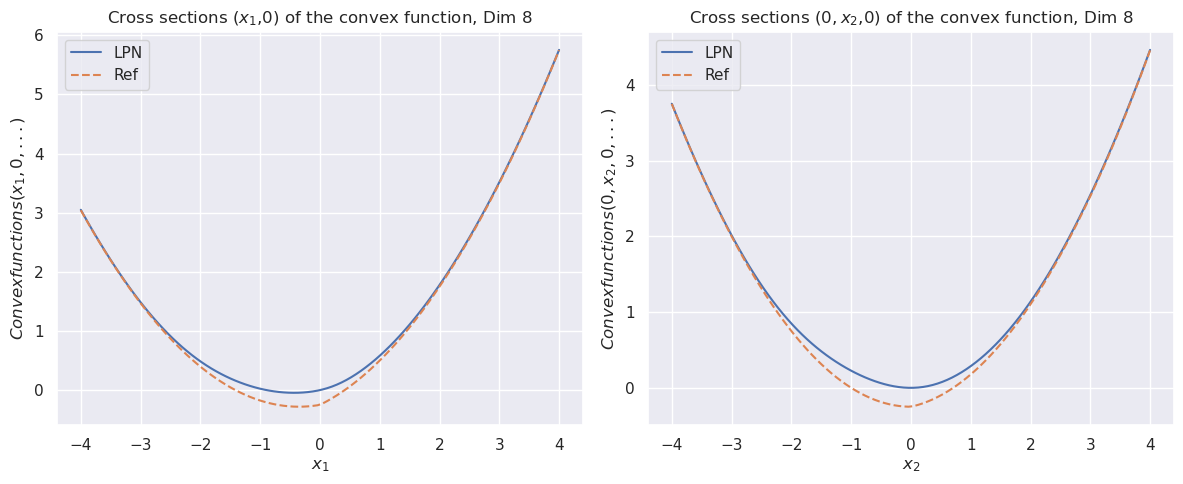
The image displays two side-by-side line charts, each plotting cross-sections of an 8-dimensional convex function. The left chart shows the cross-section along the first dimension (x₁, 0), while the right chart shows the cross-section along the second dimension (0, x₂, 0). Both charts compare two data series: "LPN" (solid blue line) and "Ref" (dashed orange line).
### Components/Axes
**Titles:**
- Left Chart: "Cross sections (x₁,0) of the convex function, Dim 8"
- Right Chart: "Cross sections (0, x₂,0) of the convex function, Dim 8"
**Y-Axis Labels:**
- Left Chart: "Convexfunctions(x₁, 0, ...)"
- Right Chart: "Convexfunctions(0, x₂, 0, ...)"
**X-Axis Labels:**
- Left Chart: "x₁"
- Right Chart: "x₂"
**Legend (Both Charts):**
- Located in the top-left corner of each plot area.
- **LPN**: Solid blue line.
- **Ref**: Dashed orange line.
**Axis Scales:**
- **X-Axis (Both Charts):** Linear scale from -4 to 4, with major ticks at integer intervals (-4, -3, -2, -1, 0, 1, 2, 3, 4).
- **Y-Axis (Left Chart):** Linear scale from 0 to 6, with major ticks at intervals of 1 (0, 1, 2, 3, 4, 5, 6).
- **Y-Axis (Right Chart):** Linear scale from 0 to 4, with major ticks at intervals of 1 (0, 1, 2, 3, 4).
### Detailed Analysis
**Left Chart (x₁ cross-section):**
- **Trend:** Both "LPN" and "Ref" series form upward-opening parabolas, symmetric around x₁ = 0. The "Ref" line is consistently slightly below the "LPN" line across the entire domain.
- **Key Data Points (Approximate):**
- At x₁ = -4: Both lines converge at y ≈ 3.0.
- At x₁ = -2: LPN ≈ 0.8, Ref ≈ 0.5.
- At x₁ = 0 (Minimum): LPN ≈ 0.0, Ref ≈ -0.2 (the only point where Ref is negative).
- At x₁ = 2: LPN ≈ 0.8, Ref ≈ 0.5.
- At x₁ = 4: Both lines converge at y ≈ 5.8.
**Right Chart (x₂ cross-section):**
- **Trend:** Similar parabolic shape as the left chart. The "Ref" line is again slightly below the "LPN" line, with the gap appearing marginally wider near the minimum.
- **Key Data Points (Approximate):**
- At x₂ = -4: Both lines converge at y ≈ 3.7.
- At x₂ = -2: LPN ≈ 0.8, Ref ≈ 0.4.
- At x₂ = 0 (Minimum): LPN ≈ 0.0, Ref ≈ -0.3.
- At x₂ = 2: LPN ≈ 0.8, Ref ≈ 0.4.
- At x₂ = 4: Both lines converge at y ≈ 4.5.
### Key Observations
1. **Convexity:** Both cross-sections for both methods (LPN, Ref) are strictly convex (parabolic).
2. **Minimum Value:** The "Ref" method achieves a slightly lower minimum value (negative) compared to "LPN" (at or near zero) in both cross-sections.
3. **Symmetry:** Both plots are symmetric about their respective axes (x₁=0 and x₂=0).
4. **Convergence at Extremes:** The two methods produce nearly identical values at the boundaries of the plotted domain (x = ±4).
5. **Magnitude Difference:** The function values in the x₁ cross-section (left chart) reach a higher maximum (~5.8) than in the x₂ cross-section (right chart, ~4.5) over the same input range [-4, 4].
### Interpretation
These charts serve as a diagnostic comparison between two methods ("LPN" and "Ref") for representing or approximating an 8-dimensional convex function. The "Ref" (Reference) method appears to be a baseline or ground truth, while "LPN" is likely a learned or approximate model.
The data suggests that the LPN model successfully captures the overall convex shape and symmetry of the reference function. However, it exhibits a consistent, small positive bias, particularly around the function's minimum. This indicates the LPN approximation is slightly less "sharp" or does not descend as deeply as the reference. The convergence at the boundaries shows the model is accurate for larger input magnitudes. The difference in maximum values between the two cross-sections implies the underlying 8D function is not perfectly isotropic; its curvature varies with direction. This visualization is crucial for validating that a learned model (LPN) preserves the fundamental geometric property (convexity) of the target function, while also quantifying its approximation error.