## Line Graphs: Cross Sections of Convex Functions in 8D Space
### Overview
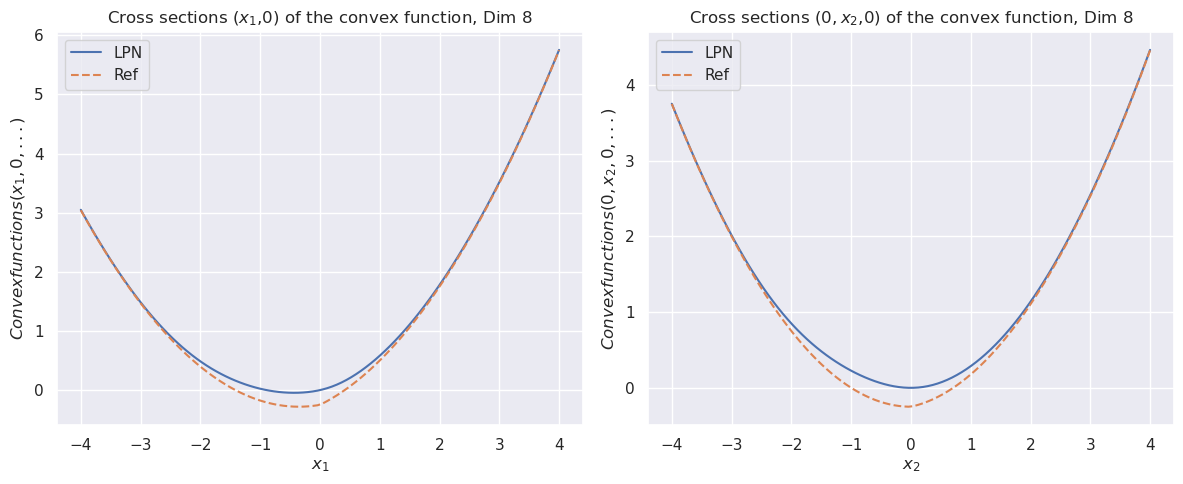
The image contains two side-by-side line graphs comparing two data series ("LPN" and "Ref") across two cross-sectional views of a convex function in 8-dimensional space. The graphs show symmetrical U-shaped curves with minor deviations between the two series.
### Components/Axes
- **Left Graph**:
- **Title**: "Cross sections (x₁,0) of the convex function, Dim 8"
- **X-axis**: Labeled "x₁" with values from -4 to 4 in increments of 1.
- **Y-axis**: Labeled "Convex functions(x₁,0, ..., )" with values from 0 to 6 in increments of 1.
- **Legend**: Top-left corner, with "LPN" (solid blue line) and "Ref" (dashed orange line).
- **Right Graph**:
- **Title**: "Cross sections (0,x₂,0) of the convex function, Dim 8"
- **X-axis**: Labeled "x₂" with values from -4 to 4 in increments of 1.
- **Y-axis**: Labeled "Convex functions(0,x₂,0, ..., )" with values from 0 to 4 in increments of 1.
- **Legend**: Top-left corner, matching the left graph's legend.
### Detailed Analysis
#### Left Graph (x₁-axis)
- **LPN (Solid Blue)**:
- Starts at ~3.0 at x₁ = -4.
- Dips to a minimum of ~-0.2 at x₁ = 0.
- Rises to ~5.8 at x₁ = 4.
- **Ref (Dashed Orange)**:
- Starts at ~3.0 at x₁ = -4.
- Dips to a minimum of ~-0.3 at x₁ = 0.
- Rises to ~5.8 at x₁ = 4.
#### Right Graph (x₂-axis)
- **LPN (Solid Blue)**:
- Starts at ~3.8 at x₂ = -4.
- Dips to a minimum of ~-0.1 at x₂ = 0.
- Rises to ~5.7 at x₂ = 4.
- **Ref (Dashed Orange)**:
- Starts at ~3.8 at x₂ = -4.
- Dips to a minimum of ~-0.2 at x₂ = 0.
- Rises to ~5.7 at x₂ = 4.
### Key Observations
1. **Symmetry**: Both graphs exhibit near-perfect symmetry around x=0, with mirrored behavior for positive and negative values.
2. **LPN vs. Ref**:
- LPN consistently shows slightly shallower troughs (higher minima) than Ref in both graphs.
- Peaks at x=±4 are nearly identical (~5.8 vs. ~5.7), suggesting convergence in high-dimensional space.
3. **Dimensional Consistency**: The y-axis ranges differ slightly (0–6 for x₁, 0–4 for x₂), likely due to scaling differences in the cross-sectional views.
### Interpretation
The graphs compare two convex function approximations ("LPN" and "Ref") in 8D space. The LPN series demonstrates marginally better performance near the origin (x=0) in both cross-sections, as evidenced by its higher (less negative) minima. However, the near-identical peak values suggest both approximations converge in regions far from the origin. The slight discrepancies in trough depths may indicate differences in optimization strategies or constraints applied to the LPN model. The symmetry implies the functions are invariant under sign changes in their input variables, a common property in high-dimensional convex optimization problems.