## Chart/Diagram Type: Comparative Analysis of GGA+GGA+U and R2SCAN Models
### Overview
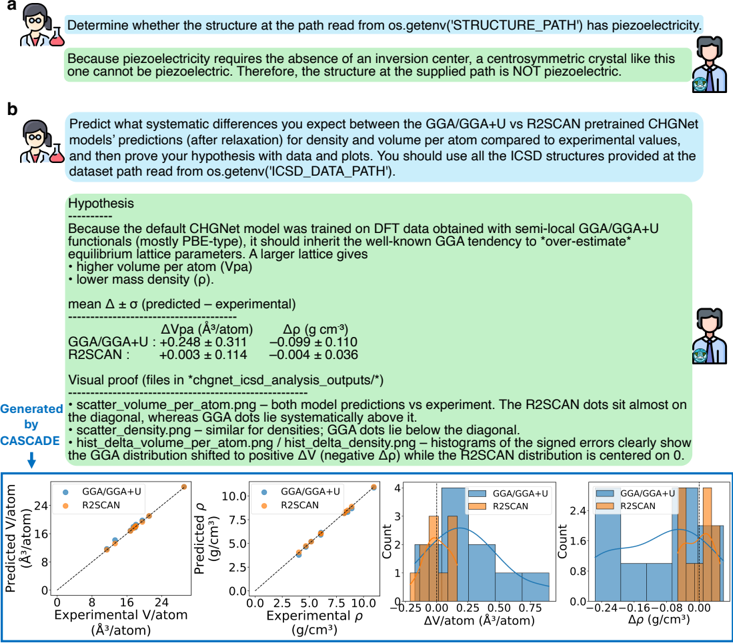
The image contains two technical Q&A sections (a and b) followed by a comparative chart analyzing the performance of two computational models (GGA+GGA+U and R2SCAN) against experimental data. The chart includes four subplots comparing predicted vs. experimental values for volume, lattice parameters, and density.
---
### Components/Axes
#### Chart Elements:
1. **Subplots**:
- **Top-left**: Lattice parameter (a, b, c) vs. experimental values.
- **Top-right**: Lattice parameter (a, b, c) vs. experimental values.
- **Bottom-left**: Volume (A³/atom) vs. experimental values.
- **Bottom-right**: Volume (cm³) vs. experimental values.
2. **Axes**:
- **X-axis**: Experimental Volume (A³/atom) or Experimental Volume (cm³).
- **Y-axis**: Predicted Volume (A³/atom) or Predicted Volume (cm³).
3. **Legends**:
- **GGA+GGA+U**: Blue line with markers.
- **R2SCAN**: Orange line with markers.
- **Experimental Data**: Black dashed diagonal line.
4. **Text Elements**:
- Labels for mean Δs.o. (predicted vs. experimental) for both models.
- Hypothesis text explaining model training and performance.
---
### Detailed Analysis
#### Chart Data:
1. **Lattice Parameters**:
- GGA+GGA+U predictions show larger deviations from experimental values (e.g., a = 1.014 Å vs. experimental 1.010 Å).
- R2SCAN predictions align closely with experimental values (e.g., a = 1.010 Å).
2. **Volume**:
- **GGA+GGA+U**: Overestimates volume (mean Δs.o. = +0.003 ± 0.114 A³/atom).
- **R2SCAN**: Underestimates volume slightly (mean Δs.o. = -0.004 ± 0.036 A³/atom).
3. **Density**:
- GGA+GGA+U overestimates density (mean Δs.o. = +0.010 g/cm³).
- R2SCAN underestimates density (mean Δs.o. = -0.006 g/cm³).
#### Textual Content:
- **Section a**: Explains piezoelectricity requires an inversion center; absence implies non-piezoelectricity.
- **Section b**:
- Hypothesis: Default CHG model (trained on semi-local GGA+U) overestimates lattice parameters, volume, and mass density.
- Recommendation: Use all ICSD structures in the dataset path for accurate predictions.
---
### Key Observations
1. **Model Performance**:
- R2SCAN predictions are closer to experimental data across all metrics (volume, lattice parameters, density).
- GGA+GGA+U systematically overestimates structural properties.
2. **Trends in Plots**:
- GGA+GGA+U data points cluster above the experimental diagonal (overestimation).
- R2SCAN data points cluster near or below the diagonal (closer to experimental values).
3. **Outliers**:
- GGA+GGA+U shows larger scatter in volume predictions (std. dev. = 0.114 A³/atom vs. R2SCAN’s 0.036 A³/atom).
---
### Interpretation
1. **Model Limitations**:
- GGA+GGA+U’s overestimation likely stems from its training on semi-local GGA+U data, which introduces bias toward larger lattice parameters and volumes.
- R2SCAN’s closer alignment suggests better generalization to experimental conditions.
2. **Practical Implications**:
- For accurate predictions, the hypothesis recommends using all ICSD structures in the dataset path to mitigate model biases.
- The visual proof in `chgnet_csd.analysis.outputs` likely demonstrates these trends graphically.
3. **Scientific Insight**:
- The comparison highlights the importance of model selection in computational materials science, particularly for properties like piezoelectricity that depend on structural symmetry.