## Data Pipeline and Factuality Alignment Diagram
### Overview
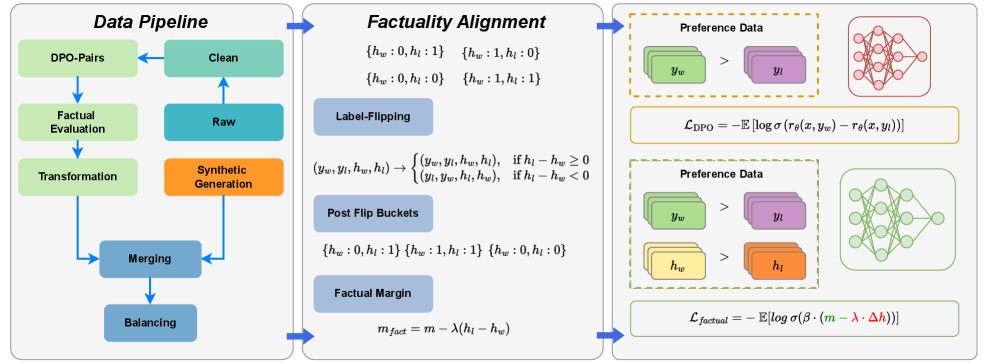
The image presents a diagram illustrating a data pipeline and a factuality alignment process. It outlines the steps involved in preparing data, aligning it with factual information, and using it for preference learning. The diagram is divided into three main sections: Data Pipeline, Factuality Alignment, and Preference Data with Loss Functions.
### Components/Axes
**Data Pipeline (Left Section):**
* **Title:** Data Pipeline
* **Components (Top to Bottom):**
* DPO-Pairs (light green rectangle)
* Clean (light green rectangle)
* Factual Evaluation (light green rectangle)
* Raw (light blue rectangle)
* Transformation (light green rectangle)
* Synthetic Generation (orange rectangle)
* Merging (light blue rectangle)
* Balancing (light blue rectangle)
* **Flow:** Arrows indicate the flow of data between components.
**Factuality Alignment (Middle Section):**
* **Title:** Factuality Alignment
* **Components:**
* Buckets:
* {hw: 0, hl: 1}
* {hw: 1, hl: 0}
* {hw: 0, hl: 0}
* {hw: 1, hl: 1}
* Label-Flipping (light blue rectangle)
* Transformation Rule:
* (yw, yl, hw, hl) -> { (yw, yl, hw, hl), if hl - hw >= 0; (yl, yw, hl, hw), if hl - hw < 0 }
* Post Flip Buckets (light blue rectangle)
* Buckets:
* {hw: 0, hl: 1}
* {hw: 1, hl: 1}
* {hw: 0, hl: 0}
* Factual Margin (light blue rectangle)
* Equation: m_fact = m - λ(hl - hw)
**Preference Data and Loss Functions (Right Section):**
* **Title:** Preference Data
* **Top Section:**
* Preference Data (dashed orange rectangle)
* yw (light green stacked rectangles) > yl (light purple stacked rectangles)
* Neural Network (red)
* Loss Function: L_DPO = -E [log σ(rθ(x, yw) - rθ(x, yl))]
* **Bottom Section:**
* Preference Data (dashed green rectangle)
* yw (light green stacked rectangles) > yl (light purple stacked rectangles)
* hw (light yellow stacked rectangles) > hl (orange stacked rectangles)
* Neural Network (green)
* Loss Function: L_factual = -E [log σ(β · (m - λ · Δh))]
### Detailed Analysis or ### Content Details
**Data Pipeline:**
* The data pipeline starts with DPO-Pairs and proceeds through cleaning, factual evaluation, transformation, and merging.
* Synthetic generation is performed after the "Raw" data stage.
* The pipeline ends with a balancing step.
**Factuality Alignment:**
* The factuality alignment section involves label flipping based on a condition involving hl and hw.
* Post-flip buckets are used to categorize data.
* The factual margin is calculated using the formula m_fact = m - λ(hl - hw).
**Preference Data and Loss Functions:**
* The top section shows a preference for yw over yl, associated with the L_DPO loss function and a red neural network.
* The bottom section shows preferences for yw over yl and hw over hl, associated with the L_factual loss function and a green neural network.
### Key Observations
* The diagram illustrates a process for aligning data with factual information and using it to train models based on preferences.
* The factuality alignment step involves label flipping and margin calculation.
* Two different loss functions (L_DPO and L_factual) are used in conjunction with different preference data scenarios.
### Interpretation
The diagram presents a methodology for incorporating factuality into preference learning. The data pipeline prepares the data, while the factuality alignment step ensures that the data is consistent with factual information. The preference data sections show how this aligned data can be used to train neural networks using different loss functions. The use of label flipping and factual margin calculation suggests an attempt to mitigate the impact of incorrect or biased labels. The two loss functions, L_DPO and L_factual, likely represent different approaches to incorporating factual information into the learning process. The diagram suggests a comprehensive approach to training models that are both aligned with factual information and capable of learning from preferences.