# Technical Document Extraction: Factuality Alignment and Data Pipeline
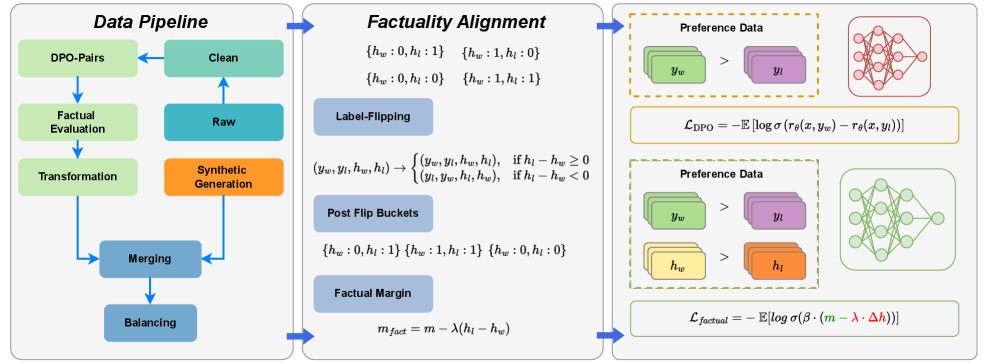
This image illustrates a three-stage technical workflow for enhancing the factuality of Large Language Models (LLMs) using Direct Preference Optimization (DPO) variants. The process is divided into three primary segments: **Data Pipeline**, **Factuality Alignment**, and the resulting **Preference Data/Loss Functions**.
---
## 1. Segment 1: Data Pipeline
This section describes the iterative process of preparing and refining data for model training.
### Components and Flow:
* **Raw (Teal Box):** The starting point of the data flow.
* **Clean (Green Box):** Data moves from Raw to Clean.
* **DPO-Pairs (Light Green Box):** Cleaned data is structured into pairs for preference learning.
* **Factual Evaluation (Light Green Box):** The pairs undergo a factuality check.
* **Transformation (Light Green Box):** Data is transformed based on evaluation results.
* **Synthetic Generation (Orange Box):** A parallel track where synthetic data is generated.
* **Merging (Blue Box):** The transformed factual data and synthetic data are combined.
* **Balancing (Blue Box):** The final step to ensure dataset distribution is optimized before moving to the next stage.
---
## 2. Segment 2: Factuality Alignment
This section details the mathematical logic used to categorize and adjust data based on factual correctness ($h$).
### Key Variables:
* $y_w$: Winning (preferred) response.
* $y_l$: Losing (non-preferred) response.
* $h_w$: Factuality score of the winning response.
* $h_l$: Factuality score of the losing response.
### Logic Blocks:
* **Initial States:** Four possible factual pairings are identified:
* $\{h_w: 0, h_l: 1\}$
* $\{h_w: 1, h_l: 0\}$
* $\{h_w: 0, h_l: 0\}$
* $\{h_w: 1, h_l: 1\}$
* **Label-Flipping:** A conditional logic operation to ensure the "winner" is the more factual response:
$$(y_w, y_l, h_w, h_l) \rightarrow \begin{cases} (y_w, y_l, h_w, h_l), & \text{if } h_l - h_w \geq 0 \\ (y_l, y_w, h_l, h_w), & \text{if } h_l - h_w < 0 \end{cases}$$
* **Post Flip Buckets:** The resulting categories after the flipping logic is applied:
* $\{h_w: 0, h_l: 1\}$
* $\{h_w: 1, h_l: 1\}$
* $\{h_w: 0, h_l: 0\}$
* **Factual Margin:** A formula to calculate the margin for the loss function:
$$m_{fact} = m - \lambda(h_l - h_w)$$
---
## 3. Segment 3: Preference Data and Loss Functions
This section shows the application of the processed data into neural network training objectives.
### Standard DPO (Top Section):
* **Preference Data:** Visualized as green blocks ($y_w$) being preferred ($>$) over purple blocks ($y_l$).
* **Model:** Represented by a red neural network diagram.
* **Loss Function ($\mathcal{L}_{\text{DPO}}$):**
$$\mathcal{L}_{\text{DPO}} = -\mathbb{E} [\log \sigma (r_\theta(x, y_w) - r_\theta(x, y_l))]$$
### Factual DPO (Bottom Section):
* **Preference Data:** Includes standard preference ($y_w > y_l$) and factual preference where yellow blocks ($h_w$) are preferred over orange blocks ($h_l$).
* **Model:** Represented by a green neural network diagram.
* **Loss Function ($\mathcal{L}_{\text{factual}}$):**
$$\mathcal{L}_{\text{factual}} = -\mathbb{E} [\log \sigma (\beta \cdot (m - \lambda \cdot \Delta h))]$$
* *Note: The terms $(m - \lambda \cdot \Delta h)$ are highlighted in green and red respectively within the formula.*
---
## Summary of Visual Mappings
| Component | Color Code | Purpose |
| :--- | :--- | :--- |
| **Synthetic Data** | Orange | Artificially generated factual samples. |
| **Winning Response ($y_w$)** | Green | The response the model should prefer. |
| **Losing Response ($y_l$)** | Purple | The response the model should avoid. |
| **Factual Score ($h$)** | Yellow/Orange | Used to weight the margin of the loss function. |
| **Standard Model** | Red | Baseline DPO training. |
| **Factual Model** | Green | Training with the integrated factual margin. |