## Diagram: Data Pipeline and Factuality Alignment
### Overview
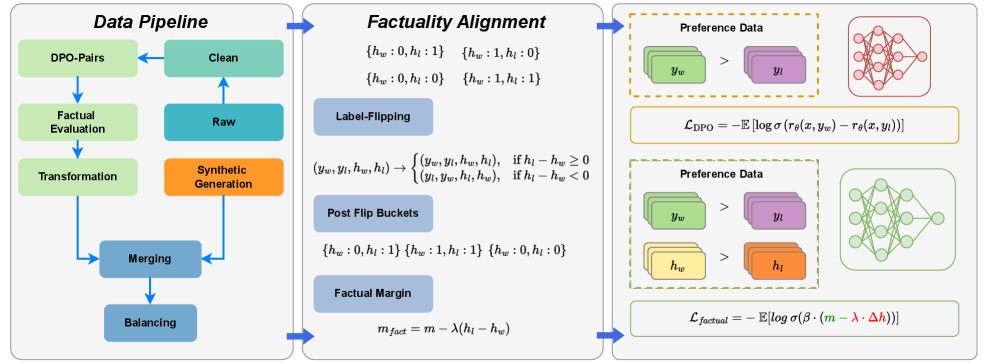
The image presents a diagram illustrating a data pipeline for processing DPO-Pairs (Direct Preference Optimization Pairs) and a factuality alignment process. The diagram is divided into two main sections: "Data Pipeline" on the left and "Factuality Alignment" on the right. The "Data Pipeline" section shows a series of steps from raw data to clean data, while the "Factuality Alignment" section details a process involving label flipping and preference data.
### Components/Axes
The diagram consists of several rectangular blocks representing processing stages. Arrows indicate the flow of data between these stages. Mathematical equations are present within the "Factuality Alignment" section. The diagram also includes representations of neural networks, visually depicted as interconnected nodes.
### Detailed Analysis or Content Details
**Data Pipeline (Left Side):**
* **DPO-Pairs:** The starting point of the pipeline.
* **Factual Evaluation:** A processing step following DPO-Pairs.
* **Transformation:** A processing step following Factual Evaluation.
* **Merging:** A processing step following Transformation.
* **Balancing:** A processing step following Merging.
* **Synthetic Generation:** A processing step that feeds into the "Clean" stage.
* **Raw:** A data source feeding into "Synthetic Generation".
* **Clean:** The output of the pipeline, receiving input from both "Synthetic Generation" and a feedback loop from "Balancing".
* Arrows indicate a flow from DPO-Pairs -> Factual Evaluation -> Transformation -> Merging -> Balancing -> Clean. A separate flow goes from Raw -> Synthetic Generation -> Clean. A feedback loop exists from Clean -> Balancing.
**Factuality Alignment (Right Side):**
* **Label-Flipping:** A central component with the following transformations:
* `(h<sub>w</sub>: 0, h<sub>i</sub>: 0)` -> `(h<sub>w</sub>: 1, h<sub>i</sub>: 0)`
* `(h<sub>w</sub>: 0, h<sub>i</sub>: 1)` -> `(h<sub>w</sub>: 1, h<sub>i</sub>: 1)`
* `(y<sub>w</sub>, y<sub>i</sub>, h<sub>w</sub>, h<sub>i</sub>)` -> `(y<sub>w</sub>, y<sub>i</sub>, h<sub>w</sub>, h<sub>i</sub>)` if h<sub>w</sub> - h<sub>i</sub> ≥ 0
* `(y<sub>w</sub>, y<sub>i</sub>, h<sub>w</sub>, h<sub>i</sub>)` -> `(y<sub>w</sub>, y<sub>i</sub>, h<sub>w</sub>, h<sub>i</sub>)` if h<sub>w</sub> - h<sub>i</sub> < 0
* **Post Flip Buckets:**
* `(h<sub>w</sub>: 0, h<sub>i</sub>: 1)`
* `(h<sub>w</sub>: 1, h<sub>i</sub>: 1)`
* `(h<sub>w</sub>: 0, h<sub>i</sub>: 0)`
* **Factual Margin:**
* m<sub>fact</sub> = m - λ(h<sub>w</sub> - h<sub>i</sub>)
* **Preference Data (Top):**
* y<sub>w</sub> > y<sub>i</sub>
* Neural network diagram with purple and orange nodes.
* Equation: L<sub>DPO</sub> = - E[log σ(r<sub>θ</sub>(x, y<sub>w</sub>) - r<sub>θ</sub>(x, y<sub>i</sub>))]
* **Preference Data (Bottom):**
* h<sub>w</sub> > h<sub>i</sub>
* Neural network diagram with purple and green nodes.
* Equation: L<sub>factual</sub> = - E[log σ(β * (m - λ * Δh))]
**Neural Networks:**
* Two neural network diagrams are present, representing the models used in the preference data processing. The top network has purple and orange nodes, while the bottom network has purple and green nodes.
### Key Observations
The diagram highlights a pipeline for refining data, specifically DPO-Pairs, through factual evaluation, transformation, merging, and balancing. The factuality alignment process focuses on adjusting labels and incorporating a factual margin to improve the accuracy and reliability of the data. The use of neural networks suggests a machine learning approach to preference modeling. The equations provided indicate loss functions used in the optimization process.
### Interpretation
This diagram illustrates a sophisticated data processing pipeline designed to enhance the quality and factual consistency of data used for training machine learning models, likely in the context of reinforcement learning from human feedback (RLHF) or direct preference optimization (DPO). The pipeline aims to address potential biases or inaccuracies in the initial data by incorporating factual evaluation and alignment techniques. The label-flipping mechanism and factual margin calculation suggest an attempt to mitigate the impact of incorrect or misleading labels. The use of preference data and neural networks indicates a focus on learning from human preferences and improving the model's ability to distinguish between desirable and undesirable outputs. The two preference data sections with different neural network node colors suggest potentially different stages or aspects of the preference learning process. The equations represent the loss functions used to train the models, guiding them towards better alignment with factual information and human preferences.