## Diagram: Multi-Stage Data Processing and Alignment System
### Overview
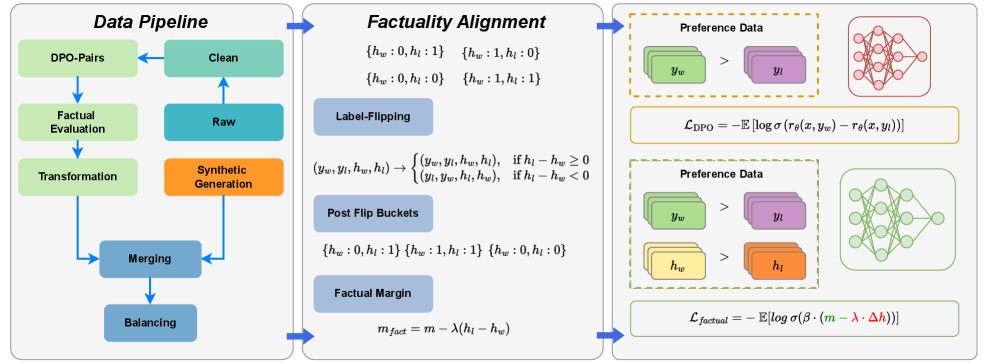
The diagram illustrates a three-stage technical pipeline for data processing and alignment, combining data engineering, factual verification, and preference modeling. The system uses color-coded components (green, blue, orange, purple) with directional arrows showing data flow and transformation relationships.
### Components/Axes
1. **Data Pipeline Section (Left)**
- **Green Boxes**: DPO-Pairs, Factual Evaluation, Transformation
- **Teal Boxes**: Clean, Raw
- **Orange Box**: Synthetic Generation
- **Blue Boxes**: Merging, Balancing
- **Arrows**: Connect components in sequential flow
- **Legend**: Color coding for data types (green=raw data, teal=processed data, orange=synthetic data, blue=aggregated data)
2. **Factuality Alignment Section (Center)**
- **Blue Boxes**: Label-Flipping, Post Flip Buckets
- **Equations**:
- `m_fact = m - λ(h_l - h_w)`
- Factual margin calculation with λ parameter
- **Arrows**: Connect label-flipping to post-flip buckets to factual margin
- **Legend**: Blue/green color coding for alignment stages
3. **Preference Data Section (Right)**
- **Green/Purple Boxes**: Preference data comparisons (y_w > y_l)
- **Equations**:
- `L_DPO = -E[logσ(r_θ(x,y_w) - r_θ(x,y_l))]`
- `L_factual = -E[logσ(β·(m - λ·Δh))]`
- **Neural Network Diagrams**:
- Red network (preference model)
- Green network (factual alignment model)
- **Legend**: Orange/green color coding for preference modeling
### Detailed Analysis
1. **Data Pipeline Flow**
- DPO-Pairs → Clean → Raw → Merging → Balancing
- Factual Evaluation → Transformation → Synthetic Generation
- Color progression: Green (raw) → Teal (cleaned) → Orange (synthetic) → Blue (balanced)
2. **Factuality Alignment Mechanics**
- Label-flipping creates four post-flip bucket combinations:
- {h_w:0,h_l:1} → {h_w:1,h_l:0}
- {h_w:0,h_l:0} → {h_w:1,h_l:1}
- Factual margin calculation adjusts based on label difference (Δh = h_l - h_w)
3. **Preference Modeling**
- Two-stage neural network architecture:
- Red network processes preference data (y_w > y_l)
- Green network handles factual alignment (h_w > h_l)
- Loss functions combine preference (L_DPO) and factual (L_factual) components
### Key Observations
1. **Data Transformation Path**: Raw data undergoes multiple transformations (cleaning, synthetic generation) before balancing
2. **Factual Verification**: Explicit margin calculation ensures factual consistency between labels
3. **Preference Integration**: Neural networks model both user preferences and factual accuracy
4. **Color-Coded Logic**: Each color represents a distinct data type or processing stage
5. **Mathematical Rigor**: Equations show probabilistic modeling (σ=sigmoid function) and margin adjustments
### Interpretation
This system appears designed for training AI models with dual objectives: factual accuracy and user preference alignment. The data pipeline ensures high-quality input data through cleaning and balancing. Factuality alignment introduces a novel approach using label-flipping and margin calculations to verify factual consistency. The preference modeling combines direct comparison (y_w > y_l) with neural network processing to optimize both preference satisfaction and factual accuracy. The use of margin adjustments (λ parameter) suggests a tunable tradeoff between factual rigor and preference alignment. The neural network diagrams indicate a sophisticated approach to modeling complex preference patterns while maintaining factual constraints.