# Technical Document Extraction: Model Performance Comparison
## 1. Image Overview
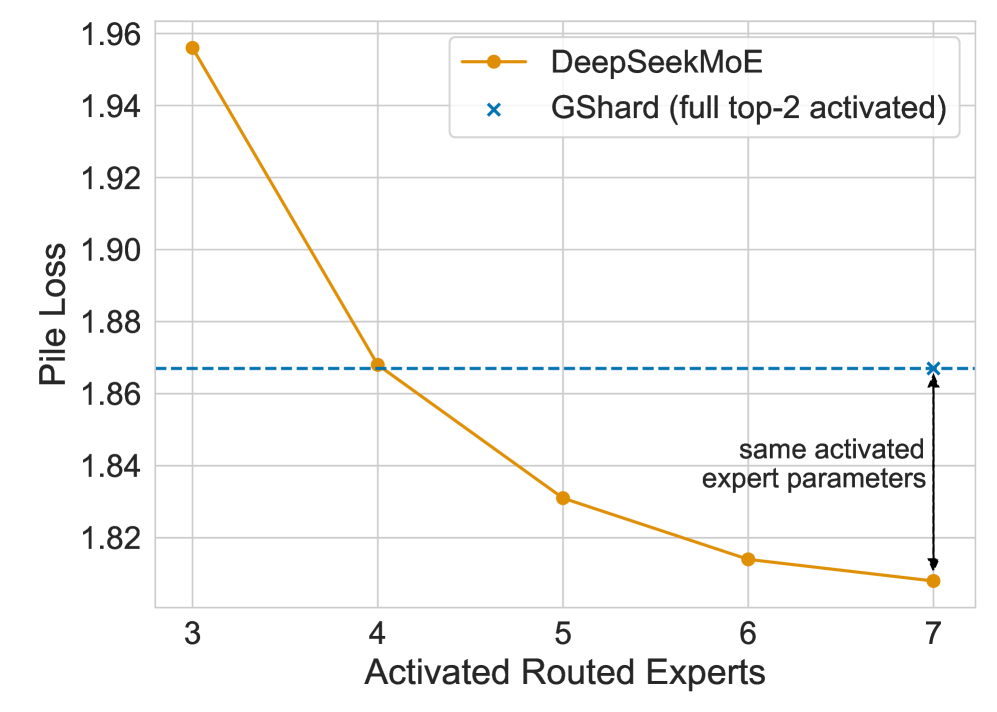
This image is a line graph comparing the performance of two Mixture-of-Experts (MoE) architectures: **DeepSeekMoE** and **GShard**. The performance metric is "Pile Loss" (lower is better) plotted against the number of "Activated Routed Experts."
## 2. Component Isolation
### A. Header / Legend
* **Location:** Top right quadrant [x: ~0.5 to 0.9, y: ~0.05 to 0.2].
* **Series 1:** Orange line with circular markers (●) labeled "**DeepSeekMoE**".
* **Series 2:** Blue 'x' marker (x) labeled "**GShard (full top-2 activated)**".
### B. Main Chart Area (Axes and Grid)
* **Y-Axis Label:** "Pile Loss" (Vertical, left side).
* **Y-Axis Scale:** Linear, ranging from 1.82 to 1.96 with increments of 0.02.
* **X-Axis Label:** "Activated Routed Experts" (Horizontal, bottom).
* **X-Axis Scale:** Discrete integer values: 3, 4, 5, 6, 7.
* **Grid:** Light grey horizontal and vertical grid lines corresponding to axis markers.
### C. Annotations
* **Horizontal Dashed Line:** A blue dashed line extends horizontally from the GShard data point (at x=7) across the chart to the y-axis at approximately 1.867.
* **Vertical Double-Headed Arrow:** Located at x=7, connecting the GShard data point (top) to the DeepSeekMoE data point (bottom).
* **Text Label:** "same activated expert parameters" positioned next to the vertical arrow.
---
## 3. Data Extraction and Trend Analysis
### Series 1: DeepSeekMoE (Orange Line)
* **Trend:** The line shows a strong downward (improving) slope. The rate of improvement is steepest between 3 and 4 experts and begins to plateau as it approaches 7 experts.
* **Data Points (Approximate):**
| Activated Routed Experts | Pile Loss (Approx.) |
| :--- | :--- |
| 3 | 1.956 |
| 4 | 1.868 |
| 5 | 1.831 |
| 6 | 1.814 |
| 7 | 1.808 |
### Series 2: GShard (Blue Marker)
* **Trend:** Represented as a single comparative data point at the far right of the x-axis.
* **Data Point:**
* (7, ~1.867)
* **Note:** The legend specifies this is "full top-2 activated."
---
## 4. Key Technical Insights
1. **Performance Parity:** DeepSeekMoE achieves a similar Pile Loss with only **4 activated routed experts** (~1.868) as GShard achieves with its full configuration at **7 activated routed experts** (~1.867).
2. **Efficiency Gain:** When both models are compared at the same number of activated routed experts (x=7), DeepSeekMoE shows a significantly lower Pile Loss (~1.808) compared to GShard (~1.867).
3. **Parameter Efficiency:** The annotation "same activated expert parameters" indicates that at x=7, despite having the same number of active parameters, DeepSeekMoE's architectural routing is more effective at reducing loss than the GShard baseline.
## 5. Text Transcription
* **Y-Axis:** Pile Loss
* **X-Axis:** Activated Routed Experts
* **Legend Item 1:** DeepSeekMoE
* **Legend Item 2:** GShard (full top-2 activated)
* **Diagram Annotation:** same activated expert parameters