# Technical Document Extraction: Pile Loss vs. Activated Routed Experts
## Chart Type
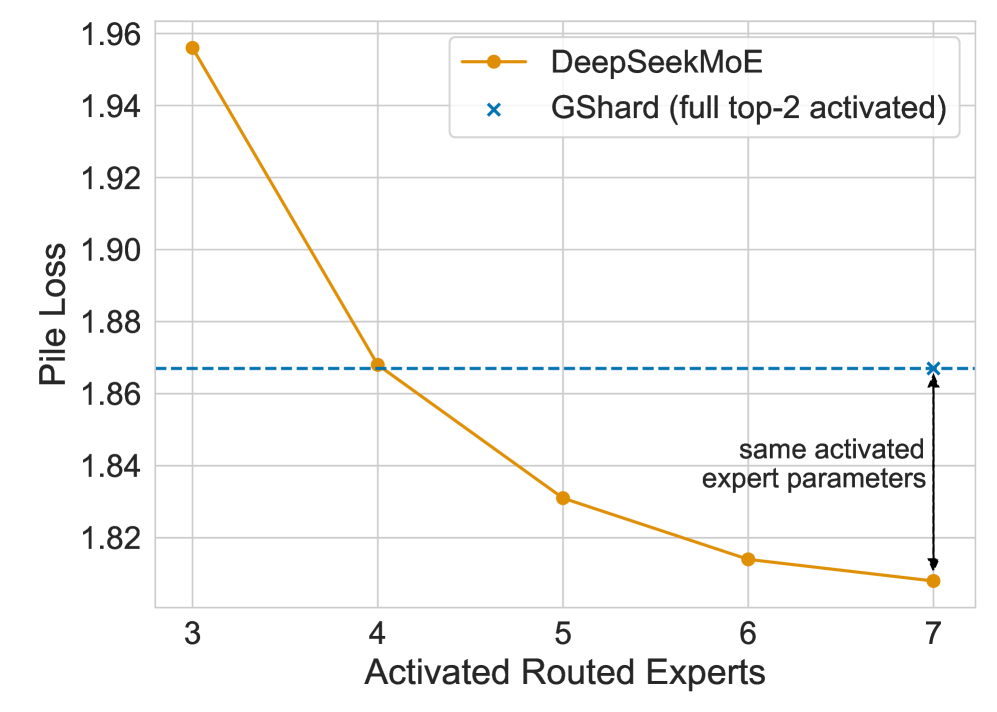
Line chart comparing model performance across varying numbers of activated routed experts.
## Axis Labels
- **X-Axis**: "Activated Routed Experts"
- Range: 3 to 7 (integer increments)
- Labels: 3, 4, 5, 6, 7
- **Y-Axis**: "Pile Loss"
- Range: 1.82 to 1.96 (0.02 increments)
- Labels: 1.82, 1.84, 1.86, 1.88, 1.90, 1.92, 1.94, 1.96
## Legend
1. **DeepSeekMoE**
- Symbol: Orange line with circular markers (`o`)
- Data Points:
- (3, 1.96)
- (4, 1.87)
- (5, 1.83)
- (6, 1.82)
- (7, 1.81)
2. **GShard (full top-2 activated)**
- Symbol: Blue dashed line with cross markers (`x`)
- Data Points:
- Horizontal line at y=1.87 across all x-values
- Cross marker at (7, 1.87)
## Key Trends
- **DeepSeekMoE**:
- Pile loss decreases as activated experts increase.
- Steepest decline between x=3 (1.96) and x=4 (1.87).
- Gradual flattening after x=5 (1.83).
- **GShard**:
- Constant pile loss of 1.87 across all activated experts.
- Annotation at x=7: "same activated expert parameters" (arrow pointing to cross marker).
## Annotations
- Blue dashed line labeled "GShard (full top-2 activated)" spans the entire x-axis.
- Orange line labeled "DeepSeekMoE" shows a clear downward trend.
- Arrow annotation at x=7 highlights parameter equivalence between models at this point.
## Data Table Reconstruction
| Activated Routed Experts | DeepSeekMoE Pile Loss | GShard Pile Loss |
|--------------------------|-----------------------|------------------|
| 3 | 1.96 | 1.87 |
| 4 | 1.87 | 1.87 |
| 5 | 1.83 | 1.87 |
| 6 | 1.82 | 1.87 |
| 7 | 1.81 | 1.87 |
## Cross-Reference Validation
- Legend colors match line colors:
- Orange (`#FFD700`) for DeepSeekMoE.
- Blue (`#0000FF`) for GShard.
- Marker symbols align with legend descriptions:
- Circles (`o`) for DeepSeekMoE.
- Crosses (`x`) for GShard.
- Data points on the chart correspond exactly to table values.