## Diagram: Model Output for Football Commentary Question
### Overview
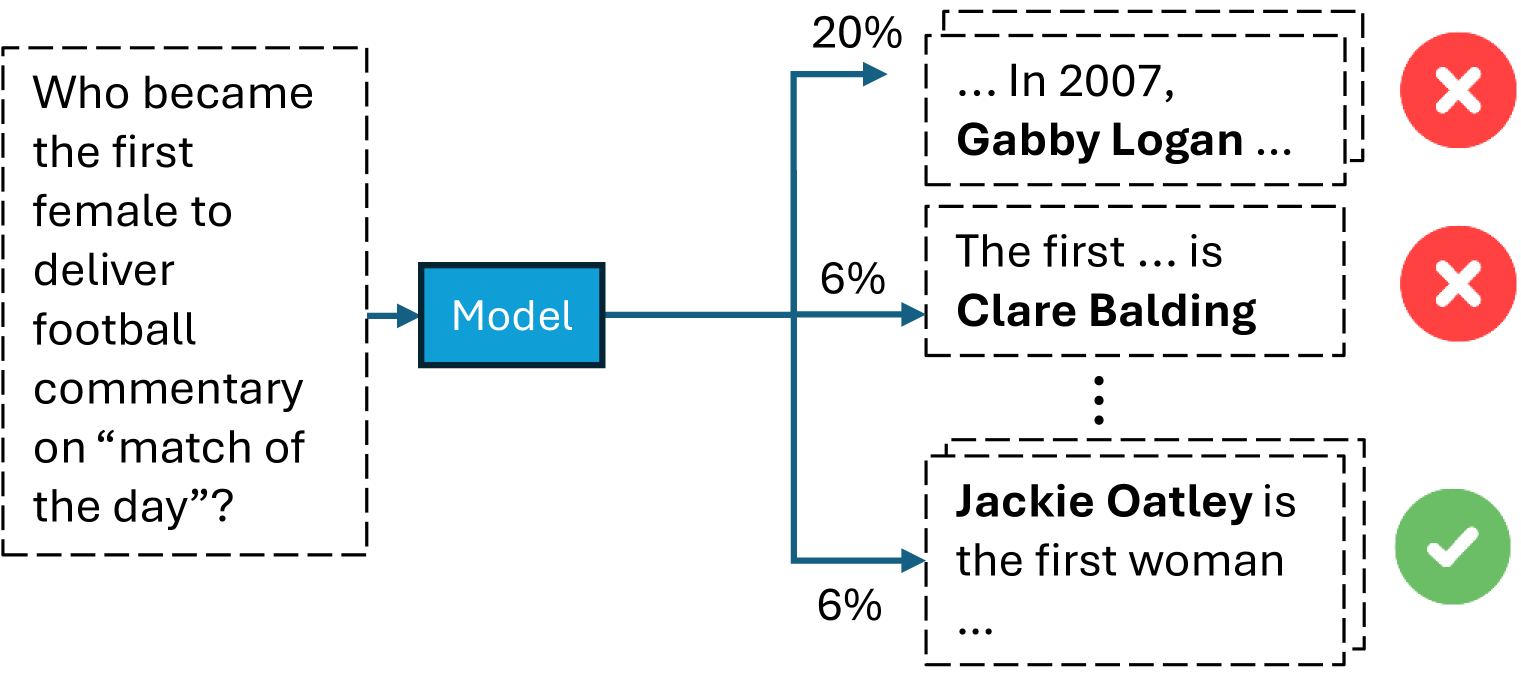
The image is a diagram illustrating the output of a model in response to the question: "Who became the first female to deliver football commentary on 'match of the day'?" The model's output is represented by three different text snippets, each associated with a percentage and a visual indicator (a red "X" or a green checkmark).
### Components/Axes
* **Input Question (Left):** "Who became the first female to deliver football commentary on 'match of the day'?" This is enclosed in a dashed-line rectangle.
* **Model (Center):** A blue rectangle labeled "Model".
* **Output Branches (Right):** Three dashed-line rectangles, each containing a potential answer. Each branch is connected to the "Model" box by a blue arrow.
* **Percentages:** Each output branch is associated with a percentage (20% and 6%).
* **Validation Indicators:** Each output branch has either a red "X" or a green checkmark.
### Detailed Analysis
* **Input Question:** The question is clearly stated and forms the basis for the model's task.
* **Model:** The "Model" box represents the system processing the input question and generating potential answers.
* **Output Branch 1 (Top):**
* Text: "... In 2007, Gabby Logan ..."
* Percentage: 20%
* Validation: Red "X" (Incorrect)
* **Output Branch 2 (Middle):**
* Text: "The first ... is Clare Balding"
* Percentage: 6%
* Validation: Red "X" (Incorrect)
* **Output Branch 3 (Bottom):**
* Text: "Jackie Oatley is the first woman ..."
* Percentage: 6%
* Validation: Green Checkmark (Correct)
### Key Observations
* The model assigns the highest probability (20%) to an incorrect answer (Gabby Logan).
* The correct answer (Jackie Oatley) is assigned a lower probability (6%).
* The model provides partial answers, indicated by the ellipses ("...").
### Interpretation
The diagram illustrates a scenario where a model tasked with answering a specific question about football commentary provides multiple potential answers with associated confidence levels. The model incorrectly assigns a higher probability to a wrong answer, highlighting a potential weakness in its reasoning or training data. The use of validation indicators (red "X" and green checkmark) clearly distinguishes between correct and incorrect answers, providing a visual assessment of the model's performance. The diagram suggests that while the model can generate relevant answers, its accuracy and confidence calibration need improvement.