# Technical Document Extraction: Line Chart Analysis
## Chart Overview
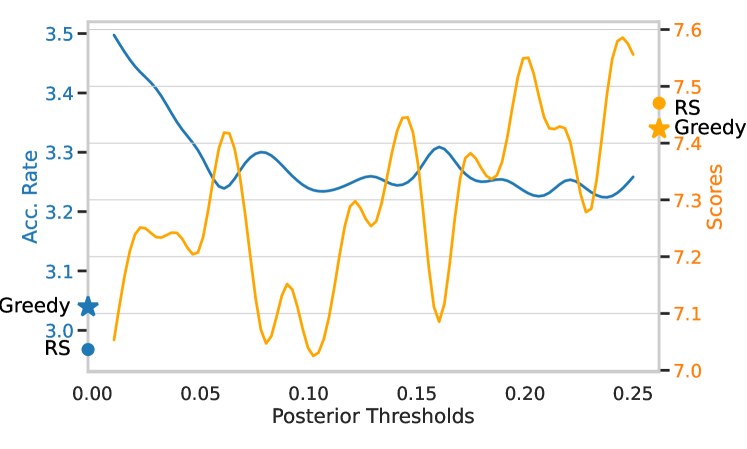
The image depicts a line chart comparing two metrics across a range of posterior thresholds. The chart includes two primary y-axes and a secondary y-axis, with distinct line representations for two algorithms.
---
## Axis Labels and Markers
### Primary Y-Axis (Left)
- **Title**: `Acc. Rate`
- **Range**: `3.0` to `3.5`
- **Markers**: Incremental ticks at `3.0`, `3.1`, `3.2`, `3.3`, `3.4`, `3.5`
### Secondary Y-Axis (Right)
- **Title**: `Scores`
- **Range**: `7.0` to `7.6`
- **Markers**: Incremental ticks at `7.0`, `7.1`, `7.2`, `7.3`, `7.4`, `7.5`, `7.6`
### X-Axis
- **Title**: `Posterior Thresholds`
- **Range**: `0.00` to `0.25`
- **Markers**: Incremental ticks at `0.00`, `0.05`, `0.10`, `0.15`, `0.20`, `0.25`
---
## Legend
- **Blue Line**: Labeled `RS`
- **Orange Line**: Labeled `Greedy`
- **Symbols**:
- `RS`: Represented by a solid blue line.
- `Greedy`: Represented by a dashed orange line with star markers at specific points.
---
## Line Descriptions
### RS (Blue Line)
- **Starting Point**: `(0.00, 3.5)`
- **Trend**:
- Initial sharp decline from `3.5` to `3.2` between `0.00` and `0.05`.
- Fluctuates between `3.2` and `3.3` with minor oscillations.
- Ends at approximately `3.25` at `0.25`.
### Greedy (Orange Line)
- **Starting Point**: `(0.00, 3.0)`
- **Trend**:
- Sharp rise to `3.3` at `0.05`, followed by a drop to `3.0` at `0.07`.
- Exhibits high volatility with peaks up to `3.4` and troughs down to `3.0`.
- Ends at approximately `3.4` at `0.25`.
---
## Key Observations
1. **Divergence in Performance**:
- `RS` maintains a relatively stable `Acc. Rate` between `3.2` and `3.3`.
- `Greedy` shows significant variability, with `Acc. Rate` fluctuating between `3.0` and `3.4`.
2. **Secondary Metric (Scores)**:
- The `Scores` axis (right) correlates with the `Acc. Rate` but is not explicitly mapped to either line. Further analysis is required to establish relationships.
3. **Critical Data Points**:
- `Greedy` achieves its highest `Acc. Rate` (`3.4`) near `0.25`.
- `RS` starts with the highest `Acc. Rate` (`3.5`) but declines steadily.
---
## Notes
- The chart uses dual y-axes to visualize two metrics (`Acc. Rate` and `Scores`) against the same x-axis (`Posterior Thresholds`).
- The `Greedy` algorithm demonstrates higher sensitivity to threshold changes compared to `RS`.
- No explicit data table is present; trends are inferred from line trajectories.