## Line Chart: Average Cost vs. Epoch
### Overview
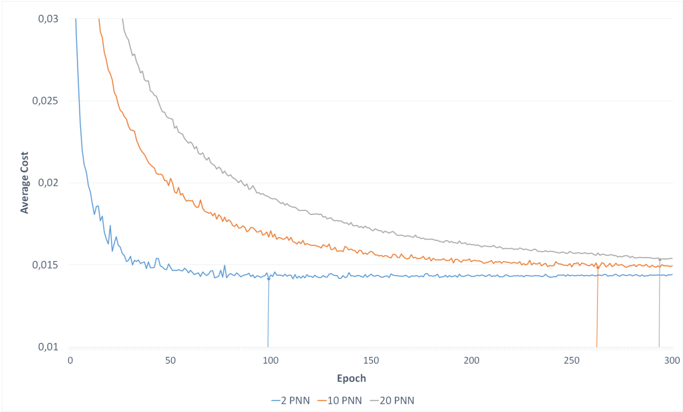
This image presents a line chart illustrating the relationship between 'Average Cost' and 'Epoch' for three different values of PNN (Potentially Nearest Neighbors). The chart displays how the average cost changes as the training progresses through epochs.
### Components/Axes
* **X-axis:** 'Epoch', ranging from approximately 0 to 300.
* **Y-axis:** 'Average Cost', ranging from approximately 0.01 to 0.03.
* **Legend:** Located at the bottom-center of the chart, identifying three lines:
* "-2 PNN" (Blue line)
* "-10 PNN" (Gray line)
* "-20 PNN" (Orange line)
### Detailed Analysis
The chart shows three lines representing the average cost for different PNN values over 300 epochs.
* **-2 PNN (Blue Line):** This line initially shows a steep decrease in average cost from epoch 0 to approximately epoch 50, dropping from around 0.028 to approximately 0.016. After epoch 50, the decrease slows down, and the line oscillates around an average cost of approximately 0.015 to 0.017. There is a sharp increase around epoch 95, rising to approximately 0.018, before returning to the previous level.
* **-10 PNN (Gray Line):** This line also exhibits a decreasing trend, but the decrease is less pronounced than the -2 PNN line. It starts at approximately 0.027 and gradually decreases to around 0.017 by epoch 300. The line is relatively smooth with minor fluctuations.
* **-20 PNN (Orange Line):** This line shows the most significant initial decrease in average cost, starting at approximately 0.029 and dropping to around 0.021 by epoch 50. The rate of decrease slows down after epoch 50, and the line continues to decrease, reaching approximately 0.016 by epoch 300. There is a noticeable increase in cost around epoch 95, similar to the -2 PNN line, rising to approximately 0.018 before decreasing again.
Approximate Data Points (extracted visually):
| Epoch | -2 PNN (Avg. Cost) | -10 PNN (Avg. Cost) | -20 PNN (Avg. Cost) |
|---|---|---|---|
| 0 | 0.028 | 0.027 | 0.029 |
| 50 | 0.016 | 0.022 | 0.021 |
| 100 | 0.018 | 0.019 | 0.018 |
| 150 | 0.016 | 0.018 | 0.017 |
| 200 | 0.017 | 0.017 | 0.016 |
| 250 | 0.016 | 0.017 | 0.016 |
| 300 | 0.016 | 0.017 | 0.016 |
### Key Observations
* The -20 PNN line consistently exhibits the highest average cost initially, but converges towards the lowest average cost by epoch 300.
* The -2 PNN line shows the most rapid initial decrease in average cost.
* Both the -2 PNN and -20 PNN lines show a temporary increase in average cost around epoch 95, suggesting a potential instability or local minimum during training.
* The -10 PNN line demonstrates the most stable and gradual decrease in average cost.
### Interpretation
The chart demonstrates the impact of different PNN values on the training process, as measured by average cost. A lower average cost generally indicates better model performance. The initial rapid decrease in cost for all lines suggests that the model is quickly learning from the training data. The convergence of the lines towards the end of the training period indicates that the model is approaching a stable state.
The temporary increase in cost around epoch 95 for the -2 and -20 PNN lines could be due to several factors, such as a change in the learning rate, encountering a difficult batch of training data, or the model getting stuck in a local minimum. The -10 PNN line's smoother descent suggests that it might be less sensitive to these fluctuations.
The choice of PNN value appears to influence the speed and stability of the training process. The -20 PNN line, while starting with a higher cost, ultimately achieves a similar or lower cost compared to the other lines, suggesting that it might be a good choice for achieving high accuracy with sufficient training. The -2 PNN line might be suitable for faster initial learning, but requires careful monitoring to avoid instability. The -10 PNN line offers a balance between speed and stability.