## Line Chart: Average Cost vs. Epoch for Different PNN Configurations
### Overview
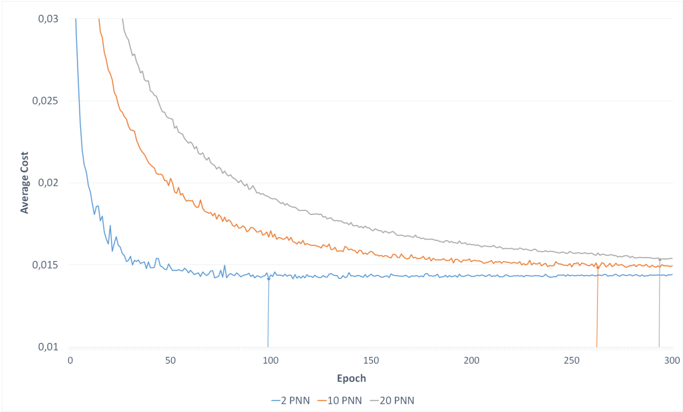
The image displays a line chart plotting "Average Cost" against "Epoch" for three different model configurations, labeled as "2 PNN," "10 PNN," and "20 PNN." The chart illustrates the training convergence behavior of these models, showing how the average cost decreases over training epochs. All three lines show a decreasing trend, with the model using fewer PNNs converging faster to a lower cost plateau.
### Components/Axes
* **Chart Type:** Line chart with three data series.
* **X-Axis:**
* **Label:** "Epoch"
* **Scale:** Linear scale from 0 to 300.
* **Major Tick Marks:** 0, 50, 100, 150, 200, 250, 300.
* **Y-Axis:**
* **Label:** "Average Cost"
* **Scale:** Linear scale from 0.01 to 0.03.
* **Major Tick Marks:** 0.01, 0.015, 0.02, 0.025, 0.03.
* **Legend:**
* **Position:** Centered at the bottom of the chart area.
* **Labels & Colors:**
* `— 2 PNN`: Blue line.
* `— 10 PNN`: Orange line.
* `— 20 PNN`: Gray line.
* **Vertical Reference Lines:** Three thin, colored vertical lines extend from the x-axis to intersect their respective data series at specific epochs:
* A blue line at approximately **Epoch 100**.
* An orange line at approximately **Epoch 260**.
* A gray line at approximately **Epoch 300**.
### Detailed Analysis
**Trend Verification & Data Points:**
1. **2 PNN (Blue Line):**
* **Trend:** Starts at a very high cost (off the top of the visible chart, >0.03) at Epoch 0. It exhibits a very steep, rapid descent in the initial phase (Epochs 0-25), followed by a sharp "elbow" and then a much slower, noisy decline. It stabilizes into a relatively flat plateau with minor fluctuations.
* **Approximate Key Points:**
* Epoch 0: Cost > 0.03 (estimated ~0.035 based on trajectory).
* Epoch ~25: Cost ~0.017.
* Epoch 50: Cost ~0.015.
* Epoch 100 (marked by blue vertical line): Cost ~0.0145.
* Epoch 300: Cost ~0.0145 (plateaued).
2. **10 PNN (Orange Line):**
* **Trend:** Starts at a high cost (off the top of the visible chart, >0.03) at Epoch 0. It descends steeply but less rapidly than the 2 PNN line. The decline is smoother with less high-frequency noise. It continues to decrease gradually throughout the displayed range.
* **Approximate Key Points:**
* Epoch 0: Cost > 0.03 (estimated ~0.032 based on trajectory).
* Epoch 50: Cost ~0.020.
* Epoch 100: Cost ~0.017.
* Epoch 200: Cost ~0.016.
* Epoch 260 (marked by orange vertical line): Cost ~0.0155.
* Epoch 300: Cost ~0.0152.
3. **20 PNN (Gray Line):**
* **Trend:** Starts at the highest initial cost (off the top of the visible chart, >0.03) at Epoch 0. It has the most gradual descent of the three lines. The curve is the smoothest, showing a steady, monotonic decrease.
* **Approximate Key Points:**
* Epoch 0: Cost > 0.03 (estimated ~0.038 based on trajectory).
* Epoch 50: Cost ~0.023.
* Epoch 100: Cost ~0.019.
* Epoch 200: Cost ~0.0165.
* Epoch 300 (marked by gray vertical line): Cost ~0.0155.
**Spatial Grounding:** The legend is positioned at the bottom-center, below the x-axis label. The vertical reference lines are color-coded to match their respective data series and are placed at the final marked epoch for each series, likely indicating a point of interest or convergence milestone.
### Key Observations
1. **Convergence Hierarchy:** The model with the fewest PNNs (2 PNN) converges the fastest, reaching a near-stable cost by Epoch 50. The 10 PNN model converges more slowly, and the 20 PNN model is the slowest to converge.
2. **Final Cost Convergence:** Despite different convergence speeds, all three models appear to be approaching a similar final average cost value in the range of **0.0145 to 0.0155** by Epoch 300. The 2 PNN model has the lowest final cost (~0.0145), while the 20 PNN model has the highest (~0.0155).
3. **Noise Level:** The 2 PNN line exhibits the most high-frequency noise or variance in its cost during training, particularly in the plateau phase. The 20 PNN line is the smoothest.
4. **Initial Cost:** The initial cost at Epoch 0 appears to increase with the number of PNNs (20 PNN > 10 PNN > 2 PNN).
### Interpretation
This chart demonstrates a classic trade-off in neural network architecture, likely related to model complexity and optimization dynamics. The "PNN" likely stands for a component like "Probabilistic Neural Network" or "Parallel Neural Network" layer.
* **Complexity vs. Convergence Speed:** Increasing the number of PNNs (from 2 to 20) increases the model's complexity. This is reflected in the slower convergence rate (more epochs needed to reduce cost) and the smoother optimization trajectory (less noise), which is typical of larger, more parameter-rich models that are harder to optimize quickly.
* **Performance Ceiling:** The fact that all models converge toward a similar cost suggests that the underlying problem or dataset has a fundamental limit to how well it can be modeled (an irreducible error). The simpler model (2 PNN) reaches this limit faster.
* **Practical Implication:** For this specific task, using a 2 PNN configuration is the most efficient choice, achieving the lowest cost in the fewest epochs. The additional complexity of 10 or 20 PNNs does not yield a better final performance within the 300-epoch window and incurs a cost in training time. The vertical markers may indicate the epoch at which each model was considered to have "converged" for practical purposes, highlighting the significant difference in training duration required.