## Line Graph: Average Cost vs. Epoch
### Overview
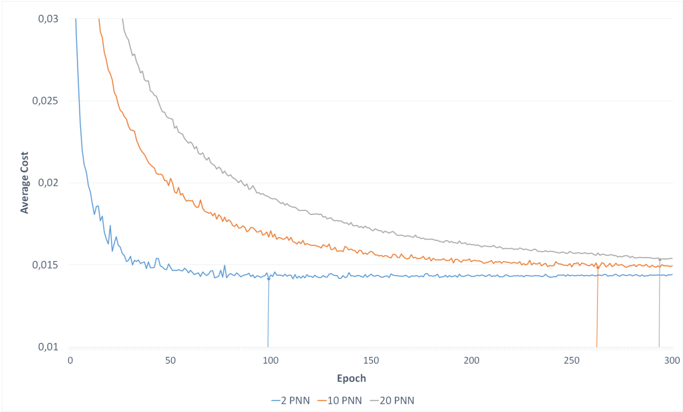
The image depicts a line graph comparing the average cost across three different configurations (2 PNN, 10 PNN, 20 PNN) over 300 epochs. The y-axis represents "Average Cost" (ranging from 0.01 to 0.03), and the x-axis represents "Epoch" (0 to 300). Three distinct lines are plotted, each corresponding to a PNN configuration.
### Components/Axes
- **X-axis (Epoch)**: Labeled "Epoch," with ticks at 0, 50, 100, 150, 200, 250, and 300.
- **Y-axis (Average Cost)**: Labeled "Average Cost," with ticks at 0.01, 0.015, 0.02, 0.025, and 0.03.
- **Legend**: Located at the bottom center, with three entries:
- **Blue line**: 2 PNN
- **Orange line**: 10 PNN
- **Gray line**: 20 PNN
### Detailed Analysis
1. **2 PNN (Blue Line)**:
- Starts at ~0.03 at epoch 0.
- Drops sharply to ~0.015 by epoch 50.
- Remains relatively flat (~0.015) from epoch 100 to 300.
- Minor fluctuations observed between epochs 50–100 (~0.014–0.015).
2. **10 PNN (Orange Line)**:
- Begins at ~0.03 at epoch 0.
- Declines gradually to ~0.015 by epoch 250.
- Stabilizes near ~0.015 by epoch 300.
- Slight dip observed at epoch 250 (~0.0145).
3. **20 PNN (Gray Line)**:
- Starts at ~0.028 at epoch 0.
- Decreases steadily to ~0.015 by epoch 300.
- Slower rate of decline compared to 2 PNN and 10 PNN.
- No significant fluctuations.
### Key Observations
- All three lines converge to a similar average cost (~0.015) by epoch 300, suggesting diminishing returns for higher PNN configurations.
- The 2 PNN configuration achieves the fastest initial cost reduction but plateaus earlier.
- The 20 PNN configuration shows the slowest but most consistent decline.
- No anomalies or outliers are evident beyond expected noise in the data.
### Interpretation
The graph demonstrates that increasing the number of PNNs (from 2 to 20) results in a slower but steadier reduction in average cost over epochs. While the 2 PNN configuration achieves rapid early improvement, it stabilizes at a higher cost than the 10 and 20 PNN configurations by epoch 300. This suggests that higher PNN counts may improve long-term optimization but require more epochs to reach convergence. The convergence of all lines at ~0.015 implies a potential lower bound for the cost metric, regardless of PNN configuration. The data highlights a trade-off between computational efficiency (fewer PNNs, faster initial gains) and long-term performance (more PNNs, gradual but sustained improvement).