## Heatmap: MFCCs of Different Actions
### Overview
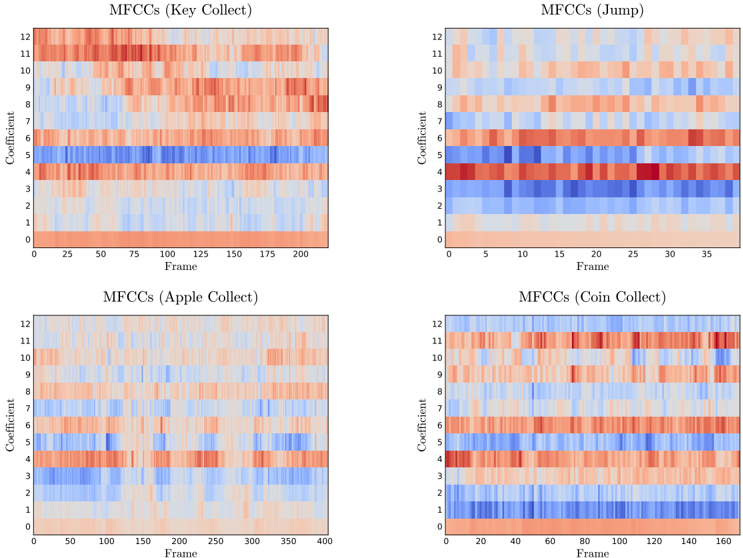
The image presents four heatmaps, each representing the Mel-Frequency Cepstral Coefficients (MFCCs) of a different action: "Key Collect", "Jump", "Apple Collect", and "Coin Collect". Each heatmap visualizes the MFCCs over time (Frame) and across different coefficients. The color intensity represents the magnitude of the MFCC value, with blue indicating lower values and red indicating higher values.
### Components/Axes
* **Titles:**
* Top-Left: "MFCCs (Key Collect)"
* Top-Right: "MFCCs (Jump)"
* Bottom-Left: "MFCCs (Apple Collect)"
* Bottom-Right: "MFCCs (Coin Collect)"
* **X-axis (Frame):**
* Top-Left: 0 to 200, incrementing by 25
* Top-Right: 0 to 35, incrementing by 5
* Bottom-Left: 0 to 400, incrementing by 50
* Bottom-Right: 0 to 160, incrementing by 20
* **Y-axis (Coefficient):**
* All plots: 0 to 12, incrementing by 1
* **Color Scale:** The color scale is implicitly defined, with blue representing lower MFCC values and red representing higher MFCC values.
### Detailed Analysis
**1. MFCCs (Key Collect)**
* **X-axis:** Frame (0 to 200)
* **Y-axis:** Coefficient (0 to 12)
* **Trend:** The heatmap shows distinct patterns across different coefficients. Coefficients 4 and 5 show consistently low values (blue), while other coefficients exhibit varying patterns of high and low values over time.
* **Data Points:**
* Coefficient 4 and 5: Consistently low values (blue) across the entire frame range.
* Coefficient 12: High values (red) from frame 0 to approximately 75, then fluctuating values.
* Coefficient 8: High values (red) from frame 100 to 200.
**2. MFCCs (Jump)**
* **X-axis:** Frame (0 to 35)
* **Y-axis:** Coefficient (0 to 12)
* **Trend:** Similar to "Key Collect", coefficients 3, 4, and 5 show consistently low values (blue). Other coefficients show more dynamic changes over time.
* **Data Points:**
* Coefficients 3, 4, and 5: Consistently low values (blue) across the entire frame range.
* Coefficient 12: High values (red) from frame 0 to 10, then fluctuating values.
* Coefficient 8: High values (red) from frame 20 to 35.
**3. MFCCs (Apple Collect)**
* **X-axis:** Frame (0 to 400)
* **Y-axis:** Coefficient (0 to 12)
* **Trend:** Coefficients 3, 4, and 5 show consistently low values (blue). The heatmap appears more uniform compared to "Key Collect" and "Jump".
* **Data Points:**
* Coefficients 3, 4, and 5: Consistently low values (blue) across the entire frame range.
* Coefficient 12: Relatively low values (light blue/white) across the entire frame range.
* Coefficient 8: High values (red) around frame 150 and 300.
**4. MFCCs (Coin Collect)**
* **X-axis:** Frame (0 to 160)
* **Y-axis:** Coefficient (0 to 12)
* **Trend:** Coefficients 3, 4, and 5 show consistently low values (blue). The heatmap shows distinct patterns across different coefficients.
* **Data Points:**
* Coefficients 3, 4, and 5: Consistently low values (blue) across the entire frame range.
* Coefficient 12: High values (red) from frame 0 to 20, then fluctuating values.
* Coefficient 8: High values (red) from frame 60 to 160.
### Key Observations
* Coefficients 3, 4, and 5 consistently show low values (blue) across all four actions.
* The "Jump" action has the shortest frame duration, while "Apple Collect" has the longest.
* The heatmaps show distinct patterns for each action, suggesting that MFCCs can be used to differentiate between them.
### Interpretation
The heatmaps visualize the MFCCs of different actions, providing a representation of the sound characteristics over time. The consistent low values in coefficients 3, 4, and 5 across all actions might indicate common acoustic features shared by these actions. The varying patterns in other coefficients likely capture the unique acoustic properties of each action. The differences in frame duration reflect the different lengths of the audio recordings for each action. The data suggests that MFCCs can be used as features for classifying different actions based on their sound.