## Heatmaps: MFCC Coefficient Analysis Across Tasks
### Overview
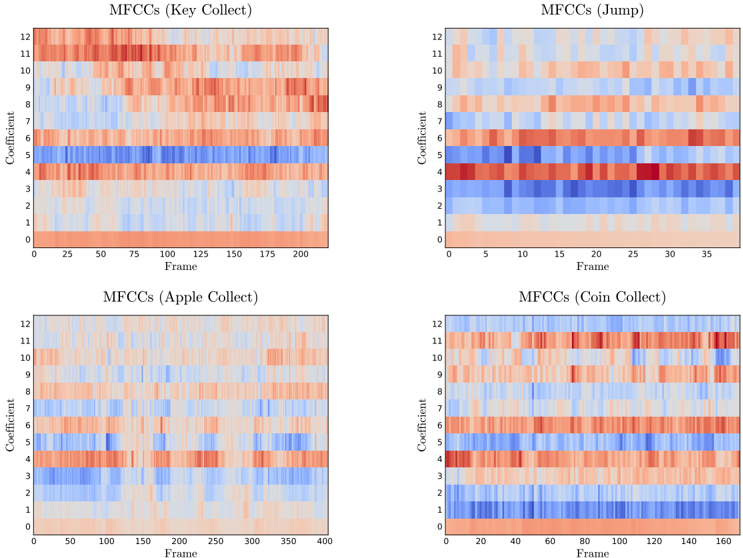
The image contains four heatmaps visualizing Mel-frequency cepstral coefficients (MFCCs) across different audio processing tasks: Key Collect, Jump, Apple Collect, and Coin Collect. Each heatmap maps coefficient values (0-12) against frame indices, with color gradients indicating magnitude (red = positive, blue = negative). Frame ranges vary per task (0-200, 0-35, 0-400, 0-160).
### Components/Axes
- **X-axis (Frame)**:
- Key Collect: 0–200 (25-unit increments)
- Jump: 0–35 (5-unit increments)
- Apple Collect: 0–400 (50-unit increments)
- Coin Collect: 0–160 (20-unit increments)
- **Y-axis (Coefficient)**: 0–12 (integer labels)
- **Legend**:
- Top-right corner
- Red = Positive values
- Blue = Negative values
- White = Neutral/zero
### Detailed Analysis
1. **Key Collect (Top-Left)**
- Frame range: 0–200
- Notable:
- Coefficient 5 shows a horizontal blue band (~frames 50–150)
- Coefficients 1–3 and 7–12 exhibit sporadic red/blue spikes
- Coefficient 0 (bottom row) is predominantly red
2. **Jump (Top-Right)**
- Frame range: 0–35
- Notable:
- Coefficient 4 has a dense red band (~frames 10–25)
- Coefficient 11 shows intermittent blue activity
- Coefficient 0 (bottom row) is mostly red
3. **Apple Collect (Bottom-Left)**
- Frame range: 0–400
- Notable:
- Coefficient 3 has a persistent blue band (~frames 50–350)
- Coefficient 9 shows sporadic red spikes
- Coefficient 0 (bottom row) is uniformly red
4. **Coin Collect (Bottom-Right)**
- Frame range: 0–160
- Notable:
- Coefficient 2 has a dense red band (~frames 40–120)
- Coefficient 11 shows intermittent blue activity
- Coefficient 0 (bottom row) is predominantly red
### Key Observations
- **Coefficient 0** (baseline) consistently shows red dominance across all tasks, suggesting strong positive energy in low-frequency components.
- Task-specific patterns:
- **Jump**: Short-duration red/blue bursts (≤35 frames)
- **Apple Collect**: Longest duration patterns (400 frames)
- **Coin Collect**: Mid-range activity with localized red/blue clusters
- **Coefficient 5** (Key Collect) and **Coefficient 3** (Apple Collect) show sustained negative activity, potentially indicating task-specific noise or filtering.
### Interpretation
The heatmaps reveal task-dependent MFCC patterns, with:
1. **Coefficient 0** acting as a universal baseline (low-frequency energy)
2. Task-specific coefficients showing distinct activation profiles:
- **Jump**: High-frequency bursts (Coefficient 4)
- **Apple Collect**: Mid-frequency suppression (Coefficient 3)
- **Coin Collect**: Mid-frequency dominance (Coefficient 2)
3. The blue/red dichotomy suggests phase relationships in audio features, with red indicating constructive interference and blue destructive interference.
These patterns could inform feature selection for audio classification models, with Coefficient 0 serving as a universal feature and task-specific coefficients (2, 3, 4, 5, 11) providing discriminative power.