## Chart Type: Line Graphs Comparing Problem Solving Performance
### Overview
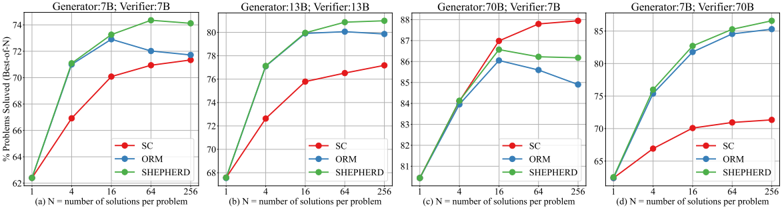
The image contains four line graphs, each comparing the performance of three different methods (SC, ORM, and SHEPHERD) in solving problems. The x-axis represents the number of solutions per problem (N), and the y-axis represents the percentage of problems solved (Best-of-N). Each graph represents a different combination of Generator and Verifier models (7B, 13B, and 70B).
### Components/Axes
* **X-axis:** N = number of solutions per problem. Values: 1, 4, 16, 64, 256. Logarithmic scale.
* **Y-axis:** % Problems Solved (Best-of-N).
* Graph (a): Scale from 62% to 74%.
* Graph (b): Scale from 68% to 80%.
* Graph (c): Scale from 81% to 88%.
* Graph (d): Scale from 62% to 88%.
* **Legend:** Located in the bottom-right of each graph.
* SC (Red line)
* ORM (Blue line)
* SHEPHERD (Green line)
* **Titles:**
* Graph (a): Generator: 7B; Verifier: 7B
* Graph (b): Generator: 13B; Verifier: 13B
* Graph (c): Generator: 70B; Verifier: 7B
* Graph (d): Generator: 7B; Verifier: 70B
### Detailed Analysis
**Graph (a): Generator: 7B; Verifier: 7B**
* **SC (Red):** Starts at approximately 62%, rises to approximately 67% at N=4, then to 70% at N=16, and plateaus around 71% for N=64 and N=256.
* **ORM (Blue):** Starts at approximately 62%, rises to approximately 71% at N=4, peaks at approximately 73% at N=16, then decreases to approximately 72% at N=64, and further to approximately 71.5% at N=256.
* **SHEPHERD (Green):** Starts at approximately 62%, rises to approximately 71% at N=4, then to 73% at N=16, and plateaus around 74% for N=64 and N=256.
**Graph (b): Generator: 13B; Verifier: 13B**
* **SC (Red):** Starts at approximately 68%, rises to approximately 72.5% at N=4, then to 76% at N=16, and plateaus around 76.5-77% for N=64 and N=256.
* **ORM (Blue):** Starts at approximately 68%, rises to approximately 77% at N=4, then to 80% at N=16, and plateaus around 80% for N=64 and N=256.
* **SHEPHERD (Green):** Starts at approximately 68%, rises to approximately 77% at N=4, then to 80% at N=16, and plateaus around 80% for N=64 and N=256.
**Graph (c): Generator: 70B; Verifier: 7B**
* **SC (Red):** Starts at approximately 81%, rises to approximately 84% at N=4, then to 87% at N=16, and plateaus around 87.5% for N=64 and N=256.
* **ORM (Blue):** Starts at approximately 81%, rises to approximately 86% at N=4, then decreases to approximately 85.5% at N=16, and further to approximately 85% at N=64 and N=256.
* **SHEPHERD (Green):** Starts at approximately 81%, rises to approximately 84% at N=4, then to 86% at N=16, and plateaus around 86% for N=64 and N=256.
**Graph (d): Generator: 7B; Verifier: 70B**
* **SC (Red):** Starts at approximately 62%, rises to approximately 67% at N=4, then to 70% at N=16, and plateaus around 71% for N=64 and N=256.
* **ORM (Blue):** Starts at approximately 62%, rises to approximately 76% at N=4, then to 82% at N=16, and plateaus around 85% for N=64 and N=256.
* **SHEPHERD (Green):** Starts at approximately 62%, rises to approximately 76% at N=4, then to 82% at N=16, and plateaus around 85% for N=64 and N=256.
### Key Observations
* In most cases, performance increases significantly from N=1 to N=16, after which it plateaus or slightly decreases.
* The SHEPHERD method generally performs as well as or better than the other two methods (SC and ORM).
* The combination of Generator and Verifier models affects the overall performance.
* When the Verifier is 70B, the performance of ORM and SHEPHERD is significantly better than when the Verifier is 7B.
### Interpretation
The graphs illustrate the impact of increasing the number of solutions per problem (N) on the performance of different problem-solving methods (SC, ORM, and SHEPHERD) using different Generator and Verifier models. The data suggests that increasing N initially leads to significant improvements in the percentage of problems solved, but beyond a certain point (around N=16), the gains diminish. This could be due to the models reaching their capacity or the diminishing returns of exploring more solutions.
The SHEPHERD method consistently performs well, suggesting it is a robust approach for these types of problems. The choice of Generator and Verifier models also plays a crucial role, with the 70B Verifier model generally leading to better performance, especially for ORM and SHEPHERD. This indicates that a more powerful Verifier can effectively leverage multiple solutions to improve accuracy.