## Line Graphs: Algorithm Performance Comparison Across Problem Sizes and Model Configurations
### Overview
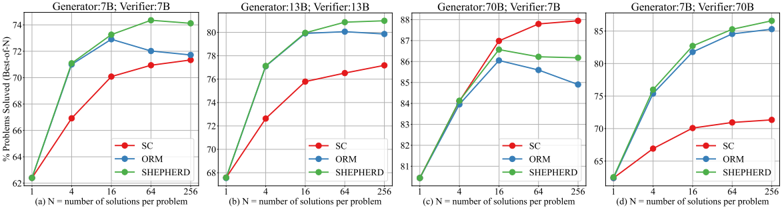
The image contains four line graphs comparing the performance of three algorithms (SC, ORM, SHEPHERD) across varying problem sizes (N = 1, 4, 16, 64, 256) and model configurations (Generator/Verifier: 7B, 13B, 70B). Each graph tracks the percentage of problems solved (% Problems Solved) as N increases, with distinct trends for each algorithm and model pair.
---
### Components/Axes
1. **Subplots**:
- (a) Generator: 7B; Verifier: 7B
- (b) Generator: 13B; Verifier: 13B
- (c) Generator: 70B; Verifier: 7B
- (d) Generator: 7B; Verifier: 70B
2. **Axes**:
- **X-axis**: Number of solutions per problem (N), labeled as "N = number of solutions per problem". Values: 1, 4, 16, 64, 256.
- **Y-axis**: Percentage of problems solved (% Problems Solved), ranging from ~62% to ~88% across subplots.
3. **Legend**:
- Located in the bottom-right corner of each subplot.
- **Colors**:
- Red: SC
- Blue: ORM
- Green: SHEPHERD
---
### Detailed Analysis
#### Subplot (a): Generator: 7B; Verifier: 7B
- **SC (Red)**: Starts at ~62% (N=1), rises sharply to ~71% (N=4), then plateaus to ~72% (N=16–256).
- **ORM (Blue)**: Begins at ~62% (N=1), peaks at ~73% (N=16), then declines slightly to ~72% (N=256).
- **SHEPHERD (Green)**: Starts at ~62% (N=1), rises steadily to ~74% (N=256).
#### Subplot (b): Generator: 13B; Verifier: 13B
- **SC (Red)**: Starts at ~68% (N=1), increases to ~76% (N=16), then plateaus to ~77% (N=256).
- **ORM (Blue)**: Begins at ~68% (N=1), rises to ~80% (N=16), then stabilizes at ~80% (N=256).
- **SHEPHERD (Green)**: Starts at ~68% (N=1), increases to ~81% (N=16), then plateaus to ~82% (N=256).
#### Subplot (c): Generator: 70B; Verifier: 7B
- **SC (Red)**: Starts at ~81% (N=1), rises sharply to ~87% (N=16), then plateaus to ~88% (N=256).
- **ORM (Blue)**: Begins at ~81% (N=1), increases to ~86% (N=16), then declines slightly to ~85% (N=256).
- **SHEPHERD (Green)**: Starts at ~81% (N=1), rises to ~86% (N=16), then plateaus to ~86% (N=256).
#### Subplot (d): Generator: 7B; Verifier: 70B
- **SC (Red)**: Starts at ~65% (N=1), increases to ~70% (N=16), then plateaus to ~71% (N=256).
- **ORM (Blue)**: Begins at ~65% (N=1), rises to ~80% (N=16), then plateaus to ~85% (N=256).
- **SHEPHERD (Green)**: Starts at ~65% (N=1), increases to ~83% (N=16), then plateaus to ~86% (N=256).
---
### Key Observations
1. **Algorithm Performance**:
- **SHEPHERD** consistently outperforms SC and ORM in most configurations, especially at larger N (e.g., N=256 in subplot d).
- **SC** shows strong performance with larger generators (e.g., 70B in subplot c) but struggles with smaller generators (e.g., subplot a).
- **ORM** performs best when the verifier matches the generator size (e.g., subplot b) but underperforms when the verifier is smaller (e.g., subplot c).
2. **Model Size Impact**:
- Larger generators (70B) generally improve performance across all algorithms, particularly for SC (subplot c).
- Mismatched generator-verifier sizes (e.g., subplot d: 7B generator, 70B verifier) reduce performance for SC but benefit ORM and SHEPHERD.
3. **Trends**:
- All algorithms show diminishing returns at N=256, suggesting saturation.
- SHEPHERD’s performance is less sensitive to N increases compared to SC and ORM.
---
### Interpretation
The data suggests that **SHEPHERD** is the most robust algorithm, maintaining high performance across varying problem sizes and model configurations. **SC** excels with large generators but falters with smaller ones, likely due to its reliance on computational resources. **ORM** performs optimally when generator and verifier sizes align, highlighting its dependency on model consistency. The results imply that algorithm choice should consider both problem complexity (N) and model scale (generator/verifier size) for optimal outcomes.