# Technical Document Extraction: Iteratively Revising Answers at Test-time
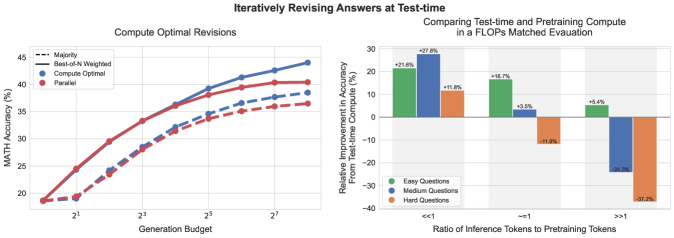
## Chart 1: Compute Optimal Revisions
### Title
- **Title**: Compute Optimal Revisions
### Axes
- **X-axis**: Generation Budget
- Labels: `2^1`, `2^3`, `2^5`, `2^7`
- **Y-axis**: MATH Accuracy (%)
- Range: 15% to 45%
### Legend
- **Location**: Top-right corner
- **Entries**:
1. **Majority** (Dashed black line)
2. **Best-of-N Weighted** (Solid black line)
3. **Compute Optimal** (Solid blue line)
4. **Parallel** (Solid red line)
### Data Trends
1. **Majority (Dashed Black)**:
- Starts at ~18% (2^1) and increases to ~37% (2^7).
- Slope: Gradual upward trend.
2. **Compute Optimal (Solid Blue)**:
- Starts at ~18% (2^1) and increases to ~43% (2^7).
- Slope: Steeper than "Majority" and "Parallel".
3. **Parallel (Solid Red)**:
- Starts at ~18% (2^1) and increases to ~40% (2^7).
- Slope: Moderate upward trend.
### Discrepancy Note
- The legend includes "Best-of-N Weighted" (solid black), but no solid black line appears in the chart. This may indicate a missing data series or a legend error.
---
## Chart 2: Comparing Test-time and Pretraining Compute in a FLOPs Matched Evaluation
### Title
- **Title**: Comparing Test-time and Pretraining Compute in a FLOPs Matched Evaluation
### Axes
- **X-axis**: Ratio of Inference Tokens to Pretraining Tokens
- Categories: `<<1`, `~=1`, `>>1`
- **Y-axis**: Relative Improvement in Accuracy From Test-time Compute (%)
- Range: -40% to +30%
### Legend
- **Location**: Top-right corner
- **Entries**:
1. **Easy Questions** (Green bars)
2. **Medium Questions** (Blue bars)
3. **Hard Questions** (Orange bars)
### Data Trends
1. **Easy Questions (Green)**:
- `<<1`: +21.6%
- `~=1`: +16.7%
- `>>1`: +5.4%
- Trend: Decreasing improvement with higher token ratios.
2. **Medium Questions (Blue)**:
- `<<1`: +27.8%
- `~=1`: +3.5%
- `>>1`: -24.3%
- Trend: Positive improvement at `<<1`, negligible at `~=1`, and significant decline at `>>1`.
3. **Hard Questions (Orange)**:
- `<<1`: +11.8%
- `~=1`: -11.9%
- `>>1`: -37.2%
- Trend: Positive improvement at `<<1`, negative at `~=1` and `>>1`, with the steepest decline at `>>1`.
### Observations
- **Token Ratio Impact**:
- All question types show diminishing returns or negative performance as the token ratio increases (`>>1`).
- Hard questions are most adversely affected by higher token ratios.
---
## Summary
- **Line Chart**: Illustrates MATH accuracy improvements across three revision strategies ("Majority," "Compute Optimal," "Parallel") as the generation budget increases. "Compute Optimal" outperforms others consistently.
- **Bar Chart**: Compares relative accuracy improvements for test-time compute vs. pretraining compute across three question difficulties. Performance declines sharply for harder questions at higher token ratios.
**Note**: All textual and numerical data extracted directly from the image. No additional languages detected.