## Chart/Diagram Type: Multi-Panel Performance Comparison
### Overview
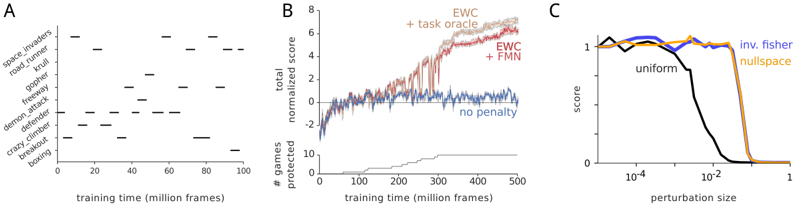
The image presents three separate charts (A, B, and C) comparing the performance of different algorithms or methods in the context of game playing and robustness to perturbations. Chart A shows the presence of specific games being played over training time. Chart B compares the normalized score and number of games protected over training time for different methods. Chart C shows the score as a function of perturbation size for different methods.
### Components/Axes
**Panel A:**
* **Type:** Presence/Absence Chart
* **Y-axis:** Game Titles (categorical): space\_invaders, road\_runner, krull, gopher, freeway, demon\_attack, defender, crazy\_climber, breakout, boxing
* **X-axis:** training time (million frames), scale from 0 to 100.
* **Data:** Horizontal black lines indicate the presence of the game being played at that training time.
**Panel B:**
* **Type:** Line Graph
* **Left Y-axis:** total normalized score, scale from -2 to 8.
* **Right Y-axis:** # games protected, scale from 0 to 10.
* **X-axis:** training time (million frames), scale from 0 to 500.
* **Legend (top-right):**
* EWC + task oracle (reddish-brown line)
* EWC + FMN (grey line)
* no penalty (blue line)
* **Data:**
* EWC + task oracle: Starts around 0, increases to approximately 6 by 300 million frames, then plateaus.
* EWC + FMN: Starts around 0, increases to approximately 1 by 200 million frames, then plateaus.
* no penalty: Starts around -2, fluctuates around 0.
* # games protected: Starts at 0, increases stepwise to approximately 8 by 300 million frames.
**Panel C:**
* **Type:** Line Graph
* **Y-axis:** score, scale from 0 to 1.
* **X-axis:** perturbation size, logarithmic scale from 10^-4 to 1.
* **Legend (right):**
* inv. fisher (blue line)
* nullspace (yellow/orange line)
* uniform (black line)
* **Data:**
* inv. fisher: Starts at 1, remains relatively constant until a perturbation size of approximately 0.1, then drops sharply to approximately 0.
* nullspace: Starts at 1, remains relatively constant until a perturbation size of approximately 0.05, then drops sharply to approximately 0.
* uniform: Starts at 1, decreases sharply starting at a perturbation size of approximately 0.005, reaching 0 around 0.1.
### Detailed Analysis or ### Content Details
**Panel A:**
* space\_invaders: Present between 10-20, 60-70, and 80-90 million frames.
* road\_runner: Present between 50-60 million frames.
* krull: Present between 70-80 million frames.
* gopher: Present between 30-40 million frames.
* freeway: Present between 40-50 million frames.
* demon\_attack: Present between 10-20, 60-70 million frames.
* defender: Present between 0-10, 20-30, 50-60 million frames.
* crazy\_climber: Present between 0-10, 90-100 million frames.
* breakout: Present between 30-40 million frames.
* boxing: Present between 80-90 million frames.
**Panel B:**
* The "EWC + task oracle" method achieves the highest normalized score, reaching approximately 6.
* The "# games protected" increases over time, suggesting the model is learning to protect more games.
* The "no penalty" method has a fluctuating score around 0, indicating less effective learning.
**Panel C:**
* The "uniform" method is most sensitive to perturbations, with its score dropping off sharply at smaller perturbation sizes.
* The "inv. fisher" and "nullspace" methods are more robust to perturbations, maintaining a high score until larger perturbation sizes.
### Key Observations
* Panel A shows a sparse distribution of game presence over training time.
* Panel B highlights the superior performance of the "EWC + task oracle" method in terms of normalized score.
* Panel C demonstrates the varying robustness of different methods to perturbations.
### Interpretation
The data suggests that the "EWC + task oracle" method is the most effective in terms of achieving a high normalized score and protecting games during training. The "uniform" method is the least robust to perturbations, while "inv. fisher" and "nullspace" offer better resilience. The presence/absence chart in Panel A indicates which games are being actively learned at different stages of training, potentially influencing the overall performance metrics shown in Panel B. The logarithmic scale in Panel C is important because it shows the relative impact of small versus large perturbations.