\n
## Chart: Error Bound and Region Visualization
### Overview
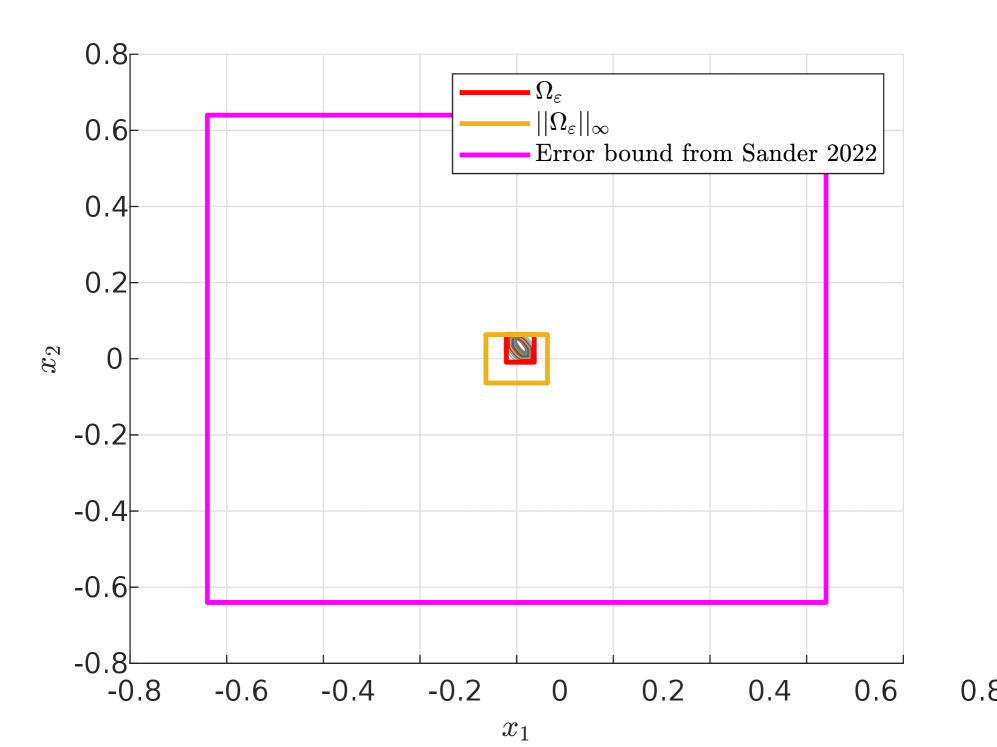
The image presents a 2D chart visualizing regions and an error bound, likely related to a mathematical or computational model. The chart displays two regions, denoted as Ωε (Omega epsilon) and ||Ωε||∞ (norm of Omega epsilon), along with an error bound derived from a source cited as "Sander 2022". The chart uses a Cartesian coordinate system with axes labeled x1 and x2.
### Components/Axes
* **X-axis:** Labeled "x1", ranging from approximately -0.8 to 0.8.
* **Y-axis:** Labeled "x2", ranging from approximately -0.8 to 0.8.
* **Legend:** Located in the top-right corner.
* Red line: Represents Ωε (Omega epsilon).
* Orange line: Represents ||Ωε||∞ (norm of Omega epsilon).
* Magenta line: Represents "Error bound from Sander 2022".
* **Grid:** A light gray grid is overlaid on the chart, aiding in visual estimation of coordinates.
### Detailed Analysis
The chart shows three distinct shapes:
1. **Ωε (Red):** This region appears as a large rectangle encompassing most of the chart area. The rectangle's corners are approximately at (-0.7, 0.6), (0.6, 0.6), (0.6, -0.7), and (-0.7, -0.7).
2. **||Ωε||∞ (Orange):** This region is a much smaller rectangle, positioned near the origin (0,0). Its corners are approximately at (-0.1, 0.1), (0.1, 0.1), (0.1, -0.1), and (-0.1, -0.1).
3. **Error bound from Sander 2022 (Magenta):** This line forms a rectangular shape around the perimeter of the chart. The top edge is approximately at y = 0.6, the bottom edge at y = -0.7, the left edge at x = -0.7, and the right edge at x = 0.6.
The magenta line (error bound) completely encloses the red region (Ωε), which in turn completely encloses the orange region (||Ωε||∞).
### Key Observations
* The orange region (||Ωε||∞) is significantly smaller than the red region (Ωε).
* The magenta line (error bound) provides an upper limit on the extent of the red region (Ωε).
* The error bound is not tight, as there is a substantial gap between the red region and the magenta line in several areas.
* The chart suggests a hierarchical relationship between the three elements: ||Ωε||∞ is contained within Ωε, and Ωε is contained within the error bound.
### Interpretation
The chart likely represents a constraint or bound on a solution space. Ωε could represent a feasible region for a particular problem, while ||Ωε||∞ might represent a specific characteristic or norm of that region. The "Error bound from Sander 2022" provides a guaranteed level of accuracy or containment for the solution.
The large gap between the red region and the magenta line suggests that the error bound is conservative, meaning it provides a safe but potentially overly restrictive limit. The small size of the orange region relative to the red region indicates that the norm of Ωε is significantly smaller than Ωε itself.
The chart could be used to assess the performance of an algorithm or model, where Ωε represents the set of possible solutions, ||Ωε||∞ represents a measure of the solution's quality, and the error bound provides a guarantee on the accuracy of the results. The citation to "Sander 2022" suggests that the error bound is based on a specific theoretical result or method developed by Sander in 2022.