## 2D Plot: Nested Rectangular Regions and Error Bounds
### Overview
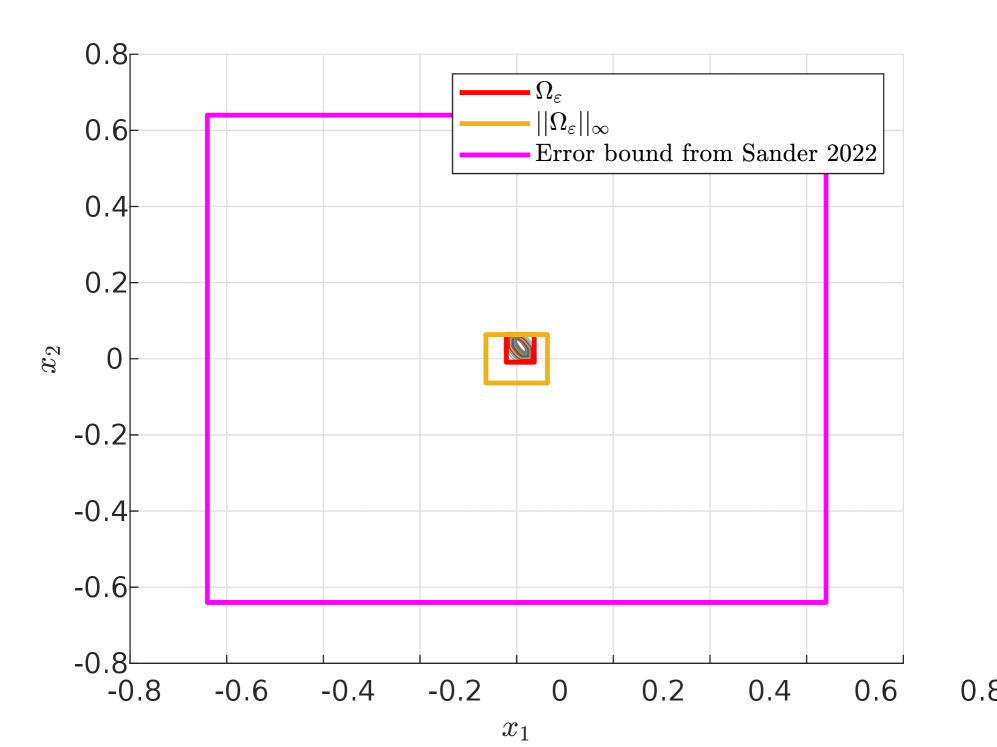
The image is a 2D Cartesian plot displaying three nested, axis-aligned rectangular regions centered at the origin (0,0). The plot visually compares the size of a specific set (Ω_ε) and its infinity norm bound (||Ω_ε||_∞) against a larger, previously established error bound from a 2022 paper by Sander.
### Components/Axes
* **Axes:**
* Horizontal Axis (x1): Linear scale ranging from -0.8 to 0.8, with major tick marks at intervals of 0.2.
* Vertical Axis (x2): Linear scale ranging from -0.8 to 0.8, with major tick marks at intervals of 0.2.
* **Legend:** Located in the top-right quadrant of the plot area. It contains three entries:
1. **Red line:** Labeled `Ω_ε`
2. **Orange line:** Labeled `||Ω_ε||_∞`
3. **Magenta line:** Labeled `Error bound from Sander 2022`
* **Grid:** A light gray grid is present, aligned with the major tick marks on both axes.
### Detailed Analysis
The plot contains three concentric rectangles, all centered at (0,0). Their boundaries are defined as follows:
1. **Innermost Rectangle (Red - `Ω_ε`):**
* **Color:** Red.
* **Position:** Centered at the origin.
* **Approximate Boundaries:** x1 ≈ [-0.05, 0.05], x2 ≈ [-0.05, 0.05].
* **Visual Trend:** This is the smallest region, representing the core set of interest.
2. **Middle Rectangle (Orange - `||Ω_ε||_∞`):**
* **Color:** Orange.
* **Position:** Centered at the origin, enclosing the red rectangle.
* **Approximate Boundaries:** x1 ≈ [-0.1, 0.1], x2 ≈ [-0.1, 0.1].
* **Visual Trend:** This rectangle is larger than the red one, representing a bound (likely the infinity norm) on the set Ω_ε.
3. **Outermost Rectangle (Magenta - `Error bound from Sander 2022`):**
* **Color:** Magenta.
* **Position:** Centered at the origin, enclosing both the red and orange rectangles.
* **Approximate Boundaries:** x1 ≈ [-0.65, 0.5], x2 ≈ [-0.65, 0.65].
* **Visual Trend:** This is the largest region by a significant margin. It represents a previously published error bound.
### Key Observations
* **Nested Containment:** There is a clear, strict nesting: `Ω_ε` (red) ⊂ `||Ω_ε||_∞` (orange) ⊂ `Error bound from Sander 2022` (magenta).
* **Scale Discrepancy:** The magenta error bound from Sander (2022) is substantially larger than the bounds represented by the red and orange rectangles. Its half-width (~0.6) is approximately 6 times larger than that of the orange rectangle (~0.1) and 12 times larger than that of the red rectangle (~0.05).
* **Symmetry:** All three rectangles are symmetric about both the x1 and x2 axes.
### Interpretation
This chart is a visual comparison of error or set bounds in a 2D parameter space (x1, x2). It demonstrates that the new bounds represented by `Ω_ε` and its norm `||Ω_ε||_∞` are significantly tighter (smaller) than the previously established bound from Sander (2022). The primary message is one of improvement: the new analysis or method yields a much more precise characterization of the region of interest (the red set) and its immediate bound (the orange set) compared to the prior work. The large magenta rectangle serves as a benchmark, highlighting the magnitude of the improvement. The chart effectively communicates that the new results are not just marginally better, but are orders of magnitude more precise in defining the relevant region in this 2D space.