## 2D Coordinate System Diagram: Error Bound Visualization
### Overview
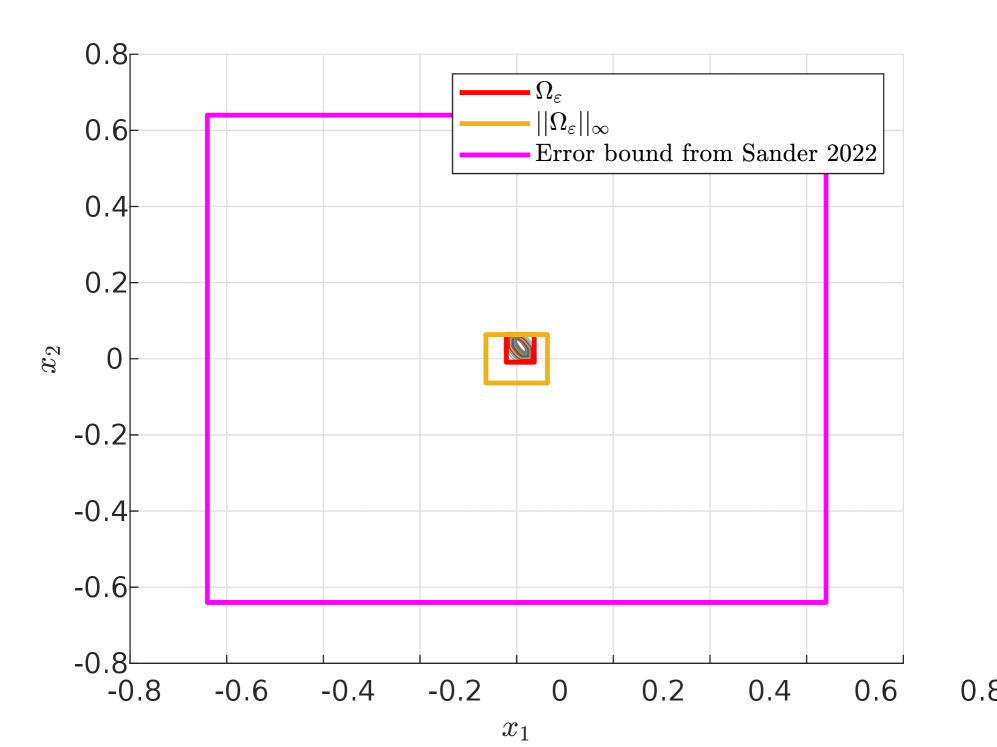
The image depicts a 2D coordinate system with axes labeled **x₁** (horizontal) and **x₂** (vertical), ranging from -0.8 to 0.8. Three nested geometric shapes are plotted:
1. A magenta square labeled **"Error bound from Sander 2022"**
2. An orange square labeled **"||Ωε||∞"**
3. A red square labeled **"Ωε"**
The legend is positioned in the **top-right corner**, and all shapes are centered at the origin (0,0).
---
### Components/Axes
- **Axes**:
- **x₁**: Horizontal axis, labeled at the bottom, ranging from -0.8 to 0.8.
- **x₂**: Vertical axis, labeled on the left, ranging from -0.8 to 0.8.
- **Legend**:
- **Red line**: Ωε (smallest square)
- **Orange line**: ||Ωε||∞ (medium square)
- **Magenta line**: Error bound from Sander 2022 (largest square)
---
### Detailed Analysis
1. **Magenta Square (Error bound from Sander 2022)**:
- Spans from **-0.6 to 0.6** on both axes.
- Forms a perfect square centered at the origin.
2. **Orange Square (||Ωε||∞)**:
- Spans from **-0.1 to 0.1** on both axes.
- Nested entirely within the magenta square.
3. **Red Square (Ωε)**:
- Spans from **-0.05 to 0.05** on both axes.
- Nested entirely within the orange square.
All shapes are axis-aligned and centered at the origin. No additional data points or annotations are present.
---
### Key Observations
- The **error bound from Sander 2022** (magenta) is the largest region, suggesting it represents the outermost tolerance or uncertainty.
- The **||Ωε||∞** (orange) and **Ωε** (red) squares are progressively smaller, indicating tighter bounds or higher precision.
- All shapes are symmetric and centered at the origin, implying the system or metric being analyzed is balanced around (0,0).
---
### Interpretation
This diagram likely visualizes **error bounds or confidence intervals** in a two-dimensional parameter space. The nested squares suggest a hierarchical relationship:
1. **Sander 2022's error bound** (magenta) defines the maximum allowable deviation.
2. **||Ωε||∞** (orange) represents a secondary, tighter constraint.
3. **Ωε** (red) is the most precise bound, indicating the smallest acceptable error.
The use of concentric squares implies that the system's performance or accuracy improves as the bounds tighten. The absence of data points outside the magenta square suggests that all observed values fall within the Sander 2022 error tolerance. The legend's placement ensures clarity in distinguishing the three bounds.
**Critical Insight**: The diagram emphasizes diminishing error margins, possibly reflecting iterative refinement in a computational or experimental process. The origin-centric design hints at symmetry in the analyzed phenomenon, such as a physical system or optimization problem.