# Technical Document Extraction: F1 Score Analysis Chart
## Chart Components
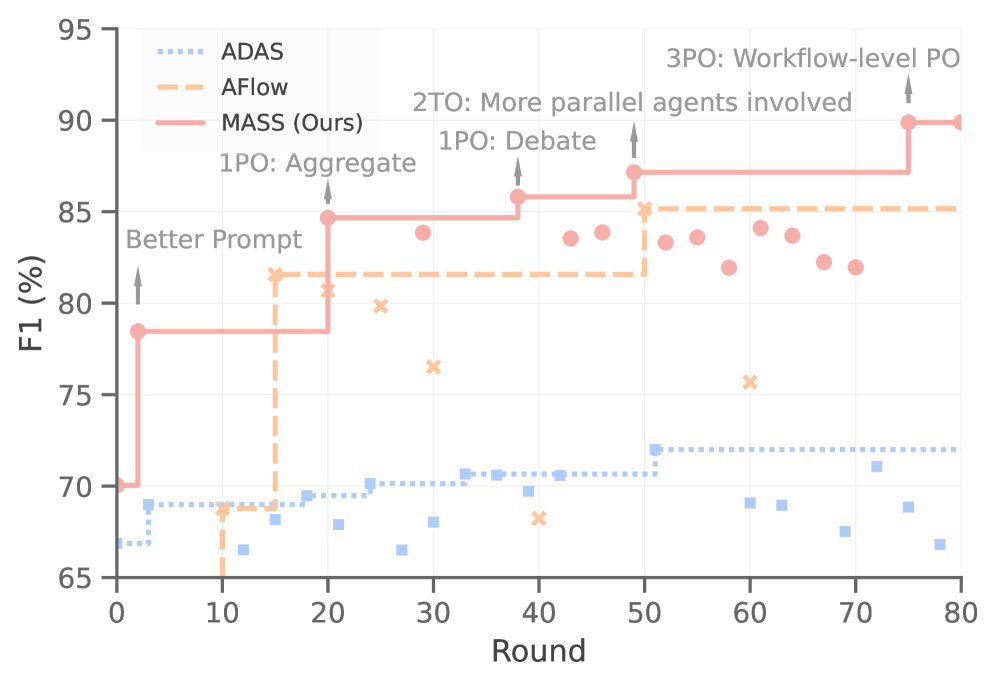
- **Title**: Not explicitly labeled (inferred from context)
- **X-Axis**:
- Label: `Round`
- Range: `0` to `80` (increments of 10)
- **Y-Axis**:
- Label: `F1 (%)`
- Range: `65` to `95` (increments of 5)
- **Legend**:
- Located in top-left corner
- Entries:
- `ADAS` (blue dotted line)
- `AFlow` (orange dashed line)
- `MASS (Ours)` (red solid line)
## Data Trends
### ADAS (Blue Dotted Line)
- **Baseline**: Stable at ~70% F1 across all rounds
- **Variance**: Minor fluctuations between 68%–72%
- **Key Observation**: No significant improvement over time
### AFlow (Orange Dashed Line)
- **Initial Value**: 70% at Round 0
- **Peak**: 81% at Round 20
- **Decline**: Drops to 76% at Round 40
- **Stabilization**: Remains ~76–81% from Round 40 onward
### MASS (Red Solid Line) [Ours]
- **Baseline**: 70% at Round 0
- **Stepwise Improvement**:
- **Round 10**: 85% (labeled `1PO: Aggregate`)
- **Round 20**: 85% (labeled `2TO: More parallel agents involved`)
- **Round 50**: 88% (labeled `3PO: Workflow-level PO`)
- **Final Value**: 90% at Round 70
- **Fluctuations**: Minor dips to 82–84% between Rounds 30–60
## Annotations
1. **`1PO: Aggregate`** (Round 10)
- Arrow points to MASS line at 85% F1
2. **`2TO: More parallel agents involved`** (Round 20)
- Arrow points to MASS line at 85% F1
3. **`3PO: Workflow-level PO`** (Round 50)
- Arrow points to MASS line at 88% F1
4. **`Better Prompt`** (Round 10–20)
- Vertical arrow between MASS line at 70% (Round 10) and 85% (Round 20)
## Key Observations
- **MASS (Ours)** demonstrates consistent, stepwise improvement in F1 score, reaching 90% by Round 70.
- **AFlow** shows temporary gains but no sustained performance.
- **ADAS** remains stagnant throughout the rounds.
- **Critical Thresholds**:
- `1PO: Aggregate` (Round 10): 85% F1
- `2TO: More parallel agents` (Round 20): 85% F1
- `3PO: Workflow-level PO` (Round 50): 88% F1
## Cross-Reference Validation
- **Legend Colors**:
- Blue (ADAS) matches dotted line
- Orange (AFlow) matches dashed line
- Red (MASS) matches solid line
- **Annotations** align with labeled data points on the MASS line.
## Summary
The chart illustrates the performance evolution of three systems (ADAS, AFlow, MASS) across 80 rounds. MASS (Ours) achieves the highest F1 score (90%) through structured improvements at key workflow stages (`1PO`, `2TO`, `3PO`), while ADAS and AFlow show limited or transient gains.