## Violin Plot: High School CS Accuracy
### Overview
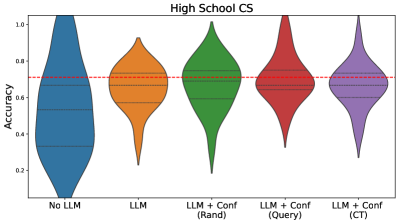
The image is a violin plot comparing the accuracy of different models on a "High School CS" task. The models vary in their use of Large Language Models (LLMs) and confidence measures. The plot shows the distribution of accuracy scores for each model. A horizontal dashed red line is present at approximately y=0.7.
### Components/Axes
* **Title:** High School CS
* **Y-axis:** Accuracy, ranging from 0.2 to 1.0 in increments of 0.2.
* **X-axis:** Categorical, representing different models:
* No LLM (Blue)
* LLM (Orange)
* LLM + Conf (Rand) (Green)
* LLM + Conf (Query) (Red)
* LLM + Conf (CT) (Purple)
### Detailed Analysis
* **No LLM (Blue):** The distribution is wide, indicating a large variance in accuracy. The bulk of the data appears to be between 0.2 and 0.7, with a peak around 0.3-0.4.
* **LLM (Orange):** The distribution is narrower than "No LLM," suggesting less variance. The bulk of the data is between 0.4 and 0.8, with a peak around 0.6-0.7.
* **LLM + Conf (Rand) (Green):** The distribution is relatively narrow and centered higher than "LLM." The bulk of the data is between 0.5 and 0.9, with a peak around 0.7-0.8.
* **LLM + Conf (Query) (Red):** The distribution is similar to "LLM + Conf (Rand)," but possibly with a slightly higher peak. The bulk of the data is between 0.6 and 1.0, with a peak around 0.7-0.8.
* **LLM + Conf (CT) (Purple):** The distribution is similar to "LLM + Conf (Rand)" and "LLM + Conf (Query)." The bulk of the data is between 0.5 and 0.9, with a peak around 0.7.
### Key Observations
* Using an LLM generally improves accuracy compared to "No LLM."
* Adding a confidence measure ("Conf") to the LLM tends to further improve accuracy.
* The different methods of incorporating confidence ("Rand," "Query," "CT") appear to yield similar accuracy distributions.
* The horizontal red line is at approximately 0.7 accuracy.
### Interpretation
The violin plot suggests that incorporating a Large Language Model (LLM) into the system improves accuracy on the "High School CS" task. Furthermore, using a confidence measure in conjunction with the LLM provides an additional boost in performance. The specific method of incorporating confidence (random, query-based, or CT) does not seem to significantly impact the overall accuracy distribution. The "No LLM" model has the lowest and most variable accuracy, indicating that the LLM is a crucial component for achieving higher and more consistent performance. The red line at 0.7 provides a visual reference point, showing which models consistently achieve accuracy above this threshold.