## Line Graphs: Boost Factor Trends for Four Individuals (1965–2005)
### Overview
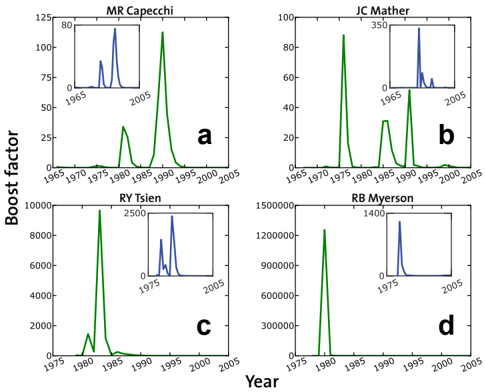
The image contains four line graphs (labeled a–d) depicting the "boost factor" trends for four individuals (MR Capechi, JC Mather, RY Tsien, RB Myerson) over 40 years (1965–2005). Each graph includes a green line representing the boost factor and a blue inset graph highlighting a zoomed-in time window. The y-axis scales vary significantly across graphs, suggesting different measurement units or magnitudes.
---
### Components/Axes
- **X-axis**: "Year" (1965–2005) for all graphs.
- **Y-axis**: "Boost factor" with distinct scales:
- **a (MR Capechi)**: 0–125
- **b (JC Mather)**: 0–100
- **c (RY Tsien)**: 0–10,000
- **d (RB Myerson)**: 0–1,500,000
- **Inset Graphs**: Blue lines, zoomed-in views of specific peaks (time range: ~1970–1985).
- **Legend**: Not explicitly labeled, but colors are consistent:
- **Green**: Main boost factor trend.
- **Blue**: Inset graph.
---
### Detailed Analysis
#### Graph a: MR Capechi
- **Main Trend**:
- Peaks at ~100 in **1985**.
- Secondary peak at ~80 in **1990**.
- Minimal activity before 1980.
- **Inset**:
- Peaks at ~80 in **1970** (narrow window: 1965–1985).
#### Graph b: JC Mather
- **Main Trend**:
- Peaks at ~80 in **1980**.
- Secondary peak at ~60 in **1990**.
- No activity before 1980.
- **Inset**:
- Peaks at ~350 in **1980** (narrow window: 1965–1985).
#### Graph c: RY Tsien
- **Main Trend**:
- Dominant peak at ~10,000 in **1980**.
- Secondary peak at ~2,500 in **1985**.
- No activity before 1980.
- **Inset**:
- Peaks at ~2,500 in **1980** (narrow window: 1975–2005).
#### Graph d: RB Myerson
- **Main Trend**:
- Dominant peak at ~1,200,000 in **1980**.
- Secondary peak at ~900,000 in **1985**.
- No activity before 1980.
- **Inset**:
- Peaks at ~1,400 in **1980** (narrow window: 1975–2005).
---
### Key Observations
1. **Peak Synchronization**: All graphs show significant boost factor spikes around **1980–1985**, suggesting a shared contextual event or measurement period.
2. **Magnitude Variability**:
- RB Myerson (d) has the highest absolute values (~1.2M), while MR Capechi (a) has the lowest (~100).
- Insets reveal smaller-scale peaks (e.g., JC Mather’s inset peaks at 350 vs. main graph’s 80).
3. **Temporal Focus**: Insets emphasize **1970–1985** for MR Capechi and **1980–1985** for others, highlighting critical periods.
---
### Interpretation
- **Contextual Events**: The synchronized peaks (1980–1985) may correlate with historical events (e.g., technological advancements, policy changes) affecting these individuals’ metrics.
- **Measurement Differences**: Disparate y-axis scales imply distinct definitions or units for "boost factor" across individuals.
- **Anomalies**:
- RY Tsien (c) and RB Myerson (d) show abrupt drops post-1985, possibly indicating metric resets or external factors.
- JC Mather (b) has a delayed peak in 1990, suggesting a lagged response to earlier events.
The data underscores the importance of granular temporal analysis (via insets) to contextualize broad trends. Further investigation into the definition of "boost factor" and external drivers is warranted.