## Diagram: Query-Thought-Action-Observation Cycle with Knowledge Graph
### Overview
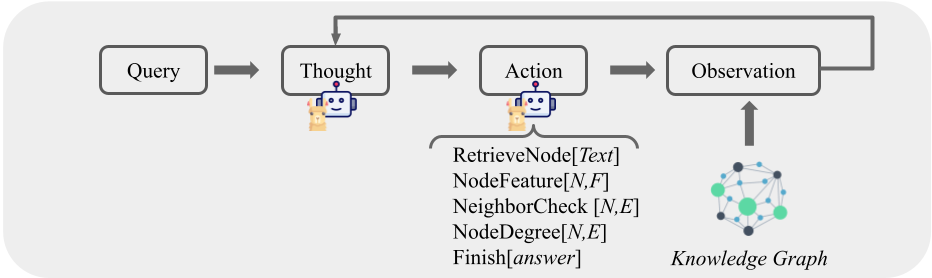
The image is a diagram illustrating a cyclical process involving a query, thought, action, and observation, with a knowledge graph providing input to the observation stage. The cycle is represented by rounded rectangles connected by arrows, indicating the flow of information.
### Components/Axes
* **Nodes:**
* Query: A rounded rectangle labeled "Query" at the beginning of the cycle.
* Thought: A rounded rectangle labeled "Thought" following the "Query" node. A small image of a llama and a robot is below the "Thought" node.
* Action: A rounded rectangle labeled "Action" following the "Thought" node. A small image of a llama and a robot is below the "Action" node.
* Observation: A rounded rectangle labeled "Observation" following the "Action" node.
* **Flow:**
* Arrows: Arrows connect the nodes in the sequence Query -> Thought -> Action -> Observation.
* Feedback Loop: An arrow connects the "Observation" node back to the "Thought" node, creating a cycle.
* Knowledge Graph Input: An arrow points from the "Knowledge Graph" up to the "Observation" node.
* **Knowledge Graph:**
* Representation: A network of interconnected nodes and edges, with some nodes colored green and others dark gray.
* Label: "Knowledge Graph" is written below the graph.
* **Action Details:**
* RetrieveNode[Text]
* NodeFeature[N,F]
* NeighborCheck[N,E]
* NodeDegree[N,E]
* Finish[answer]
### Detailed Analysis
The diagram depicts a closed-loop system where a "Query" initiates a "Thought" process, leading to an "Action." The "Action" results in an "Observation," which is informed by a "Knowledge Graph." The "Observation" then feeds back into the "Thought" process, creating a continuous cycle.
The "Action" node is further detailed with a list of specific actions:
* RetrieveNode[Text]: Retrieves a node based on text.
* NodeFeature[N,F]: Extracts features from a node, denoted by N and F.
* NeighborCheck[N,E]: Checks the neighbors of a node, denoted by N and E.
* NodeDegree[N,E]: Determines the degree of a node, denoted by N and E.
* Finish[answer]: Completes the process with an answer.
The Knowledge Graph is represented visually as a network of nodes and edges. Some nodes are colored green, while others are dark gray.
### Key Observations
* The diagram emphasizes the iterative nature of the process, with the "Observation" influencing subsequent "Thought" processes.
* The "Knowledge Graph" plays a crucial role in informing the "Observation" stage.
* The "Action" node is broken down into specific actions, providing more detail about this stage.
### Interpretation
The diagram illustrates a system where a query is processed through a series of steps, leveraging a knowledge graph to inform the observation and subsequent decision-making. The cyclical nature of the process suggests continuous learning and refinement based on observations. The inclusion of specific actions within the "Action" node provides insight into the types of operations performed during this stage. The presence of the Knowledge Graph highlights the importance of structured knowledge in the overall process. The llama and robot images below the "Thought" and "Action" nodes may represent different types of agents or models involved in these stages.