## IV Curve: RESET: CMO defect depletion
### Overview
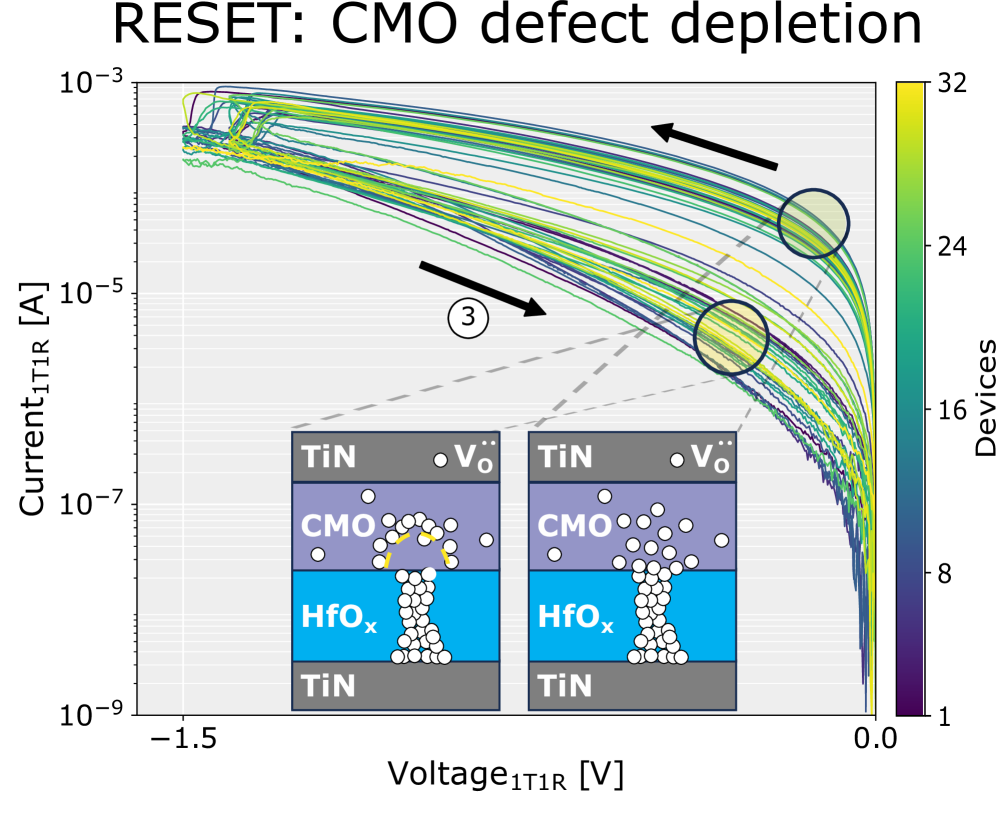
The image shows a plot of current (I) versus voltage (V) characteristics for multiple devices, illustrating the RESET process in a CMO (presumably a complex metal oxide) defect depletion scenario. The plot includes a color bar indicating the number of devices, ranging from 1 to 32. Insets show diagrams of the device structure with defect distribution.
### Components/Axes
* **Title:** RESET: CMO defect depletion
* **Y-axis:** Current$_{1T1R}$ [A] (logarithmic scale from 10$^{-9}$ to 10$^{-3}$)
* **X-axis:** Voltage$_{1T1R}$ [V] (linear scale from -1.5 to 0.0)
* **Colorbar:** Devices (ranging from 1 to 32, with color gradient from dark purple to yellow)
* **Diagram Insets:** Two diagrams showing the device structure with layers of TiN, CMO, and HfO$_x$, and the distribution of oxygen vacancies (Vö).
### Detailed Analysis
* **Y-Axis (Current):** The y-axis is a logarithmic scale representing the current, ranging from 10$^{-9}$ A to 10$^{-3}$ A. The grid lines are spaced at each order of magnitude.
* **X-Axis (Voltage):** The x-axis represents the voltage, ranging from -1.5 V to 0.0 V. The grid lines are spaced at 0.5 V intervals.
* **Data Series:** There are multiple curves plotted on the graph, each representing a device. The color of each curve corresponds to the number of devices, as indicated by the colorbar.
* **Colorbar (Devices):** The colorbar on the right side of the plot indicates the number of devices, ranging from 1 (dark purple) to 32 (yellow). The color gradient shows a continuous transition between these values. The colorbar has labeled ticks at 1, 8, 16, 24, and 32.
* **Diagram Insets:**
* Each inset shows a stack of materials: TiN (Titanium Nitride), CMO (Complex Metal Oxide), and HfO$_x$ (Hafnium Oxide).
* The left diagram shows a sparse distribution of white circles (representing defects or oxygen vacancies) in the CMO layer and a concentrated region of defects in the HfO$_x$ layer. An arrow indicates the movement of defects from the CMO to the HfO$_x$ layer.
* The right diagram shows a depleted CMO layer and a more concentrated region of defects in the HfO$_x$ layer.
* "Vö" is labeled near the top of the CMO layer, indicating oxygen vacancies.
* **Arrows:** Two black arrows are present on the main chart, indicating the direction of the RESET process.
* **Number 3:** A circled number "3" is present on the main chart, near the center.
* **Curve Trends:**
* The curves generally start at a low current level (around 10$^{-9}$ A) at a voltage of -1.5 V.
* As the voltage increases towards 0 V, the current initially remains low.
* At a certain voltage (varying between -1.5V and -0.5V), the current abruptly increases, indicating the RESET process.
* The curves then converge towards a higher current level (around 10$^{-3}$ A) as the voltage approaches 0 V.
* The color of the curves varies from dark purple to yellow, indicating different numbers of devices exhibiting similar behavior.
### Key Observations
* The RESET process is characterized by a sudden increase in current at a specific voltage.
* The voltage at which the RESET occurs varies between devices.
* The number of devices influences the density of curves, with yellow curves representing a higher number of devices.
* The diagrams illustrate the redistribution of defects during the RESET process, with defects moving from the CMO layer to the HfO$_x$ layer.
### Interpretation
The data suggests that the RESET process in the CMO device involves the depletion of defects (likely oxygen vacancies) in the CMO layer and their accumulation in the HfO$_x$ layer. The IV curves show that the voltage required to trigger the RESET process varies between devices, possibly due to variations in the initial defect distribution or material properties. The color-coding of the curves indicates that the observed behavior is consistent across multiple devices, with some devices exhibiting more pronounced RESET characteristics than others. The diagrams provide a visual representation of the defect redistribution mechanism, supporting the interpretation of the IV curves. The arrows on the main chart indicate the direction of the RESET process, showing the change in current as the voltage increases.