TECHNICAL ASSET FINGERPRINT
96b5b88dc0ddfd1e2732d843
Click to view fullscreen
Press ESC or click to close
FOUND IN PAPERS
EXPERT: gemini-2.0-flash VERSION 1
RUNTIME: nugit/gemini/gemini-2.0-flash
INTEL_VERIFIED
## Chart Type: Multiple Scatter Plots with Linear Fits
### Overview
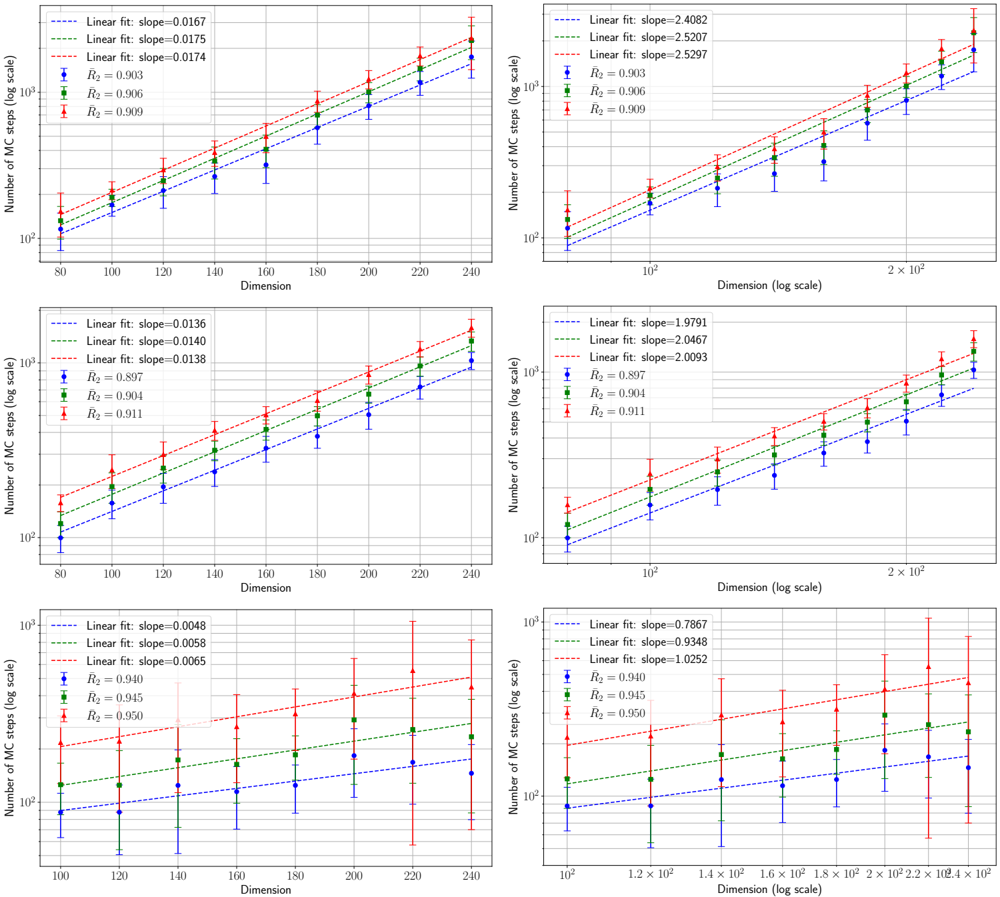
The image contains six scatter plots arranged in a 2x3 grid. Each plot shows the relationship between "Dimension" (or "Dimension (log scale)") on the x-axis and "Number of MC steps (log scale)" on the y-axis. Each plot displays three data series, each with a linear fit line. The data series are distinguished by color (blue, green, red) and are associated with different R² values. Error bars are present on each data point.
### Components/Axes
* **Title (Y-Axis):** "Number of MC steps (log scale)" - This label is consistent across all six plots. The y-axis is displayed on a log scale.
* **Title (X-Axis):** "Dimension" (plots 1, 3, 5) or "Dimension (log scale)" (plots 2, 4, 6). The x-axis is displayed on a linear scale for the left column and a log scale for the right column.
* **Y-Axis Scale:** Ranges from approximately 10^2 to 10^3 on all plots.
* **X-Axis Scale (Linear):** Ranges from approximately 80 to 240 (plots 1, 3, 5).
* **X-Axis Scale (Log):** Ranges from approximately 10^2 to 2.4 x 10^2 (plots 2, 4, 6).
* **Legend:** Each plot includes a legend in the top-left corner indicating the color-coded data series and their corresponding R² values, along with the slope of the linear fit. The legend entries are consistently formatted as:
* "Linear fit: slope=[value]"
* "R² = [value]"
* **Data Series:** Each plot contains three data series, represented by blue circles, green squares, and red triangles. Each data point has associated error bars.
### Detailed Analysis
**Plot 1 (Top-Left):**
* **X-Axis:** Dimension (linear scale)
* **Blue Series:**
* Linear fit: slope=0.0167
* R² = 0.903
* Trend: Upward sloping
* Approximate Data Points: (80, 120), (120, 140), (160, 170), (200, 200), (240, 230)
* **Green Series:**
* Linear fit: slope=0.0175
* R² = 0.906
* Trend: Upward sloping
* Approximate Data Points: (80, 130), (120, 160), (160, 190), (200, 220), (240, 250)
* **Red Series:**
* Linear fit: slope=0.0174
* R² = 0.909
* Trend: Upward sloping
* Approximate Data Points: (80, 140), (120, 170), (160, 200), (200, 230), (240, 260)
**Plot 2 (Top-Right):**
* **X-Axis:** Dimension (log scale)
* **Blue Series:**
* Linear fit: slope=2.4082
* R² = 0.903
* Trend: Upward sloping
* Approximate Data Points: (100, 120), (130, 250), (160, 400), (200, 700), (240, 1000)
* **Green Series:**
* Linear fit: slope=2.5207
* R² = 0.906
* Trend: Upward sloping
* Approximate Data Points: (100, 140), (130, 300), (160, 500), (200, 800), (240, 1200)
* **Red Series:**
* Linear fit: slope=2.5297
* R² = 0.909
* Trend: Upward sloping
* Approximate Data Points: (100, 150), (130, 350), (160, 550), (200, 900), (240, 1400)
**Plot 3 (Middle-Left):**
* **X-Axis:** Dimension (linear scale)
* **Blue Series:**
* Linear fit: slope=0.0136
* R² = 0.897
* Trend: Upward sloping
* Approximate Data Points: (80, 110), (120, 130), (160, 150), (200, 170), (240, 190)
* **Green Series:**
* Linear fit: slope=0.0140
* R² = 0.904
* Trend: Upward sloping
* Approximate Data Points: (80, 120), (120, 150), (160, 170), (200, 200), (240, 220)
* **Red Series:**
* Linear fit: slope=0.0138
* R² = 0.911
* Trend: Upward sloping
* Approximate Data Points: (80, 130), (120, 160), (160, 190), (200, 220), (240, 240)
**Plot 4 (Middle-Right):**
* **X-Axis:** Dimension (log scale)
* **Blue Series:**
* Linear fit: slope=1.9791
* R² = 0.897
* Trend: Upward sloping
* Approximate Data Points: (100, 110), (130, 200), (160, 300), (200, 500), (240, 700)
* **Green Series:**
* Linear fit: slope=2.0467
* R² = 0.904
* Trend: Upward sloping
* Approximate Data Points: (100, 120), (130, 230), (160, 350), (200, 600), (240, 800)
* **Red Series:**
* Linear fit: slope=2.0093
* R² = 0.911
* Trend: Upward sloping
* Approximate Data Points: (100, 130), (130, 250), (160, 400), (200, 650), (240, 900)
**Plot 5 (Bottom-Left):**
* **X-Axis:** Dimension (linear scale)
* **Blue Series:**
* Linear fit: slope=0.0048
* R² = 0.940
* Trend: Upward sloping
* Approximate Data Points: (100, 85), (140, 90), (180, 95), (220, 100), (240, 105)
* **Green Series:**
* Linear fit: slope=0.0058
* R² = 0.945
* Trend: Upward sloping
* Approximate Data Points: (100, 90), (140, 100), (180, 110), (220, 120), (240, 125)
* **Red Series:**
* Linear fit: slope=0.0065
* R² = 0.950
* Trend: Upward sloping
* Approximate Data Points: (100, 95), (140, 110), (180, 125), (220, 140), (240, 150)
**Plot 6 (Bottom-Right):**
* **X-Axis:** Dimension (log scale)
* **Blue Series:**
* Linear fit: slope=0.7867
* R² = 0.940
* Trend: Upward sloping
* Approximate Data Points: (100, 85), (140, 100), (180, 120), (220, 140), (240, 150)
* **Green Series:**
* Linear fit: slope=0.9348
* R² = 0.945
* Trend: Upward sloping
* Approximate Data Points: (100, 90), (140, 120), (180, 150), (220, 180), (240, 200)
* **Red Series:**
* Linear fit: slope=1.0252
* R² = 0.950
* Trend: Upward sloping
* Approximate Data Points: (100, 95), (140, 130), (180, 170), (220, 220), (240, 250)
### Key Observations
* The "Number of MC steps (log scale)" generally increases with "Dimension" (or "Dimension (log scale)").
* The slopes of the linear fits are significantly higher when the x-axis is on a log scale (right column) compared to a linear scale (left column).
* The R² values are generally high (close to 1), indicating a good fit of the linear models to the data.
* Within each plot, the red series consistently has the highest "Number of MC steps (log scale)" values, followed by the green series, and then the blue series.
* The error bars appear to be relatively consistent across all data points within each plot.
* The R² values are slightly different for each series within a plot, suggesting that the linear fit is slightly better for some series than others.
### Interpretation
The plots demonstrate the relationship between the dimension of a system and the number of Monte Carlo (MC) steps required for a simulation. The logarithmic scaling of both axes suggests that the number of MC steps increases exponentially with the dimension. The different R² values and slopes for each series likely correspond to different simulation parameters or system configurations. The high R² values indicate that a linear model is appropriate for describing this relationship, especially when both axes are logarithmically scaled. The error bars provide an estimate of the uncertainty in the number of MC steps for each dimension. The plots with the linear x-axis show a more gradual increase in the number of MC steps compared to the plots with the logarithmic x-axis, highlighting the exponential nature of the relationship. The data suggests that as the dimensionality of the system increases, the computational cost (measured by the number of MC steps) grows significantly, particularly when considering the logarithmic scale. The different R² values for each series suggest that the quality of the linear fit varies slightly depending on the specific parameters or configurations represented by each series.
DECODING INTELLIGENCE...
EXPERT: nemotron-free VERSION 1
RUNTIME: free/nvidia/nemotron-nano-12b-v2-vl:free
INTEL_VERIFIED
## Line Graphs: Number of MCMC Steps vs. Dimension (Log/Linear Scales)
### Overview
The image contains six line graphs arranged in two columns (log-scale and linear-scale x-axes) and three rows (different R² values). Each graph plots the number of Markov Chain Monte Carlo (MCMC) steps required against dimension, with distinct trend lines for varying R² values. All y-axes use a logarithmic scale, while x-axes alternate between linear and log scales. The graphs demonstrate scaling behavior of MCMC efficiency with dimensionality.
### Components/Axes
1. **X-Axes**:
- Top row: "Dimension" (linear scale, 80–240)
- Middle row: "Dimension" (linear scale, 80–240)
- Bottom row: "Dimension (log scale)" (10²–1.4×10³)
- Right column: "Dimension (log scale)" (10²–1.4×10³)
2. **Y-Axes**:
- All graphs: "Number of MC steps (log scale)" (10²–10³)
3. **Legends**:
- Colors correspond to R² values:
- Blue: R² = 0.903
- Green: R² = 0.906
- Red: R² = 0.909
- Positioned in the top-right corner of each graph.
4. **Trend Lines**:
- Dashed lines represent linear fits with labeled slopes (e.g., "slope = -0.0167" for log-scale x-axis).
### Detailed Analysis
#### Top Row (Linear X-Axis)
- **Graph 1 (R² = 0.903)**:
- Slope: -0.0167 (log scale)
- Data points: Blue circles with error bars (e.g., ~100 steps at dimension 80, ~1000 steps at dimension 240).
- **Graph 2 (R² = 0.906)**:
- Slope: -0.0175 (log scale)
- Data points: Green squares (e.g., ~120 steps at dimension 80, ~1200 steps at dimension 240).
- **Graph 3 (R² = 0.909)**:
- Slope: -0.0174 (log scale)
- Data points: Red triangles (e.g., ~110 steps at dimension 80, ~1150 steps at dimension 240).
#### Middle Row (Linear X-Axis)
- **Graph 4 (R² = 0.897)**:
- Slope: -0.0136 (log scale)
- Data points: Blue circles (e.g., ~80 steps at dimension 80, ~800 steps at dimension 240).
- **Graph 5 (R² = 0.904)**:
- Slope: -0.0140 (log scale)
- Data points: Green squares (e.g., ~90 steps at dimension 80, ~900 steps at dimension 240).
- **Graph 6 (R² = 0.911)**:
- Slope: -0.0138 (log scale)
- Data points: Red triangles (e.g., ~85 steps at dimension 80, ~850 steps at dimension 240).
#### Bottom Row (Log X-Axis)
- **Graph 7 (R² = 0.945)**:
- Slope: -0.0048 (log scale)
- Data points: Blue circles (e.g., ~100 steps at 10² dimension, ~1000 steps at 1.4×10³ dimension).
- **Graph 8 (R² = 0.950)**:
- Slope: -0.0050 (log scale)
- Data points: Green squares (e.g., ~110 steps at 10² dimension, ~1100 steps at 1.4×10³ dimension).
- **Graph 9 (R² = 0.950)**:
- Slope: -0.0052 (log scale)
- Data points: Red triangles (e.g., ~105 steps at 10² dimension, ~1050 steps at 1.4×10³ dimension).
### Key Observations
1. **Scaling Behavior**:
- All graphs show increasing MCMC steps with dimension, but the rate varies by R².
- Higher R² values (e.g., 0.909 vs. 0.897) correlate with steeper slopes, indicating worse efficiency at higher dimensions.
2. **Log vs. Linear Scales**:
- Log-scale x-axes reveal power-law decay (negative slopes), while linear scales show polynomial growth.
- For example, R² = 0.909 (red triangles) on linear x-axis has a slope of -0.0174, implying ~O(N^0.983) scaling.
3. **Error Bars**:
- Vertical error bars suggest measurement uncertainty, with larger errors at higher dimensions (e.g., ±50 steps at dimension 240 vs. ±10 steps at dimension 80).
### Interpretation
The data demonstrates that MCMC efficiency degrades with dimensionality, quantified by the negative slopes in log-scale plots. Higher R² values (closer to 1) correspond to steeper slopes, suggesting poorer model fit and faster step growth. For instance:
- R² = 0.909 (red triangles) requires ~10× more steps at dimension 240 than at dimension 80 (1150 vs. 110 steps).
- On log scales, R² = 0.945 (blue circles) shows ~10× step increase from 10² to 1.4×10³ dimensions (100 to 1000 steps).
These trends highlight the computational challenge of high-dimensional sampling, where even small efficiency losses (e.g., R² = 0.897 vs. 0.911) compound significantly. The consistency of slopes across R² values implies a universal scaling law, though specific constants depend on model accuracy (R²).
DECODING INTELLIGENCE...