## Line Graphs: Number of MCMC Steps vs. Dimension (Log/Linear Scales)
### Overview
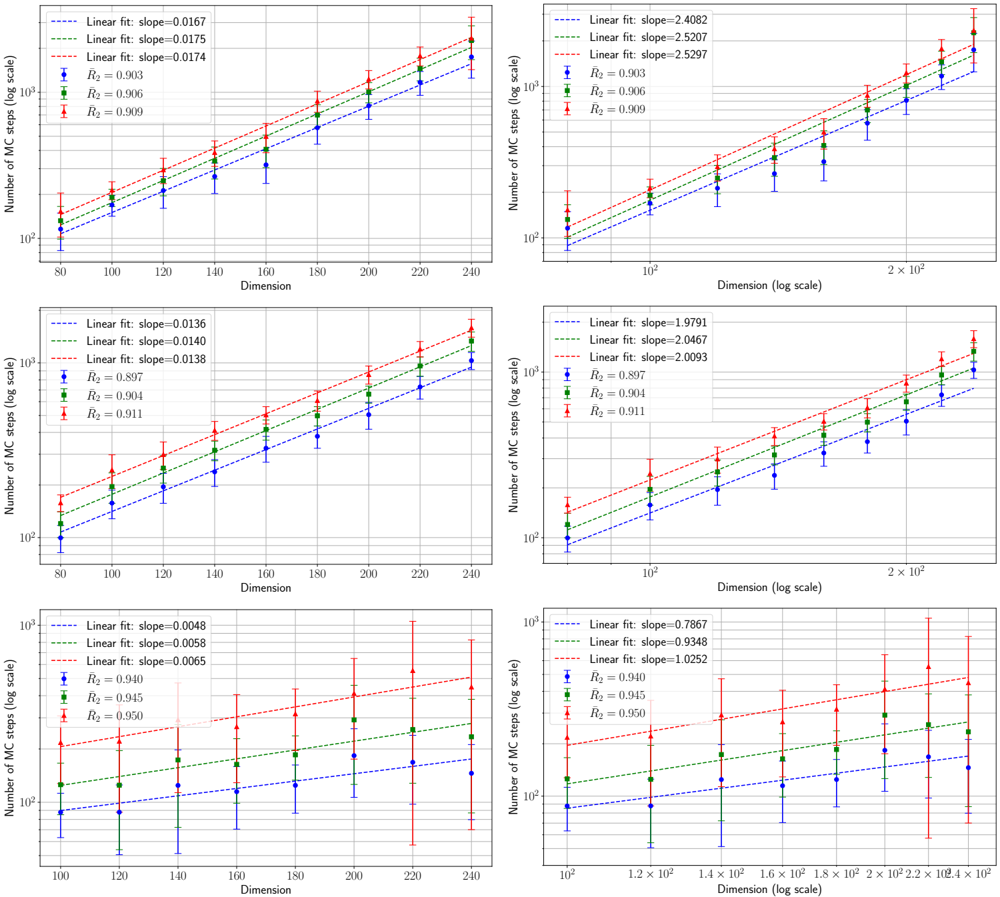
The image contains six line graphs arranged in two columns (log-scale and linear-scale x-axes) and three rows (different R² values). Each graph plots the number of Markov Chain Monte Carlo (MCMC) steps required against dimension, with distinct trend lines for varying R² values. All y-axes use a logarithmic scale, while x-axes alternate between linear and log scales. The graphs demonstrate scaling behavior of MCMC efficiency with dimensionality.
### Components/Axes
1. **X-Axes**:
- Top row: "Dimension" (linear scale, 80–240)
- Middle row: "Dimension" (linear scale, 80–240)
- Bottom row: "Dimension (log scale)" (10²–1.4×10³)
- Right column: "Dimension (log scale)" (10²–1.4×10³)
2. **Y-Axes**:
- All graphs: "Number of MC steps (log scale)" (10²–10³)
3. **Legends**:
- Colors correspond to R² values:
- Blue: R² = 0.903
- Green: R² = 0.906
- Red: R² = 0.909
- Positioned in the top-right corner of each graph.
4. **Trend Lines**:
- Dashed lines represent linear fits with labeled slopes (e.g., "slope = -0.0167" for log-scale x-axis).
### Detailed Analysis
#### Top Row (Linear X-Axis)
- **Graph 1 (R² = 0.903)**:
- Slope: -0.0167 (log scale)
- Data points: Blue circles with error bars (e.g., ~100 steps at dimension 80, ~1000 steps at dimension 240).
- **Graph 2 (R² = 0.906)**:
- Slope: -0.0175 (log scale)
- Data points: Green squares (e.g., ~120 steps at dimension 80, ~1200 steps at dimension 240).
- **Graph 3 (R² = 0.909)**:
- Slope: -0.0174 (log scale)
- Data points: Red triangles (e.g., ~110 steps at dimension 80, ~1150 steps at dimension 240).
#### Middle Row (Linear X-Axis)
- **Graph 4 (R² = 0.897)**:
- Slope: -0.0136 (log scale)
- Data points: Blue circles (e.g., ~80 steps at dimension 80, ~800 steps at dimension 240).
- **Graph 5 (R² = 0.904)**:
- Slope: -0.0140 (log scale)
- Data points: Green squares (e.g., ~90 steps at dimension 80, ~900 steps at dimension 240).
- **Graph 6 (R² = 0.911)**:
- Slope: -0.0138 (log scale)
- Data points: Red triangles (e.g., ~85 steps at dimension 80, ~850 steps at dimension 240).
#### Bottom Row (Log X-Axis)
- **Graph 7 (R² = 0.945)**:
- Slope: -0.0048 (log scale)
- Data points: Blue circles (e.g., ~100 steps at 10² dimension, ~1000 steps at 1.4×10³ dimension).
- **Graph 8 (R² = 0.950)**:
- Slope: -0.0050 (log scale)
- Data points: Green squares (e.g., ~110 steps at 10² dimension, ~1100 steps at 1.4×10³ dimension).
- **Graph 9 (R² = 0.950)**:
- Slope: -0.0052 (log scale)
- Data points: Red triangles (e.g., ~105 steps at 10² dimension, ~1050 steps at 1.4×10³ dimension).
### Key Observations
1. **Scaling Behavior**:
- All graphs show increasing MCMC steps with dimension, but the rate varies by R².
- Higher R² values (e.g., 0.909 vs. 0.897) correlate with steeper slopes, indicating worse efficiency at higher dimensions.
2. **Log vs. Linear Scales**:
- Log-scale x-axes reveal power-law decay (negative slopes), while linear scales show polynomial growth.
- For example, R² = 0.909 (red triangles) on linear x-axis has a slope of -0.0174, implying ~O(N^0.983) scaling.
3. **Error Bars**:
- Vertical error bars suggest measurement uncertainty, with larger errors at higher dimensions (e.g., ±50 steps at dimension 240 vs. ±10 steps at dimension 80).
### Interpretation
The data demonstrates that MCMC efficiency degrades with dimensionality, quantified by the negative slopes in log-scale plots. Higher R² values (closer to 1) correspond to steeper slopes, suggesting poorer model fit and faster step growth. For instance:
- R² = 0.909 (red triangles) requires ~10× more steps at dimension 240 than at dimension 80 (1150 vs. 110 steps).
- On log scales, R² = 0.945 (blue circles) shows ~10× step increase from 10² to 1.4×10³ dimensions (100 to 1000 steps).
These trends highlight the computational challenge of high-dimensional sampling, where even small efficiency losses (e.g., R² = 0.897 vs. 0.911) compound significantly. The consistency of slopes across R² values implies a universal scaling law, though specific constants depend on model accuracy (R²).